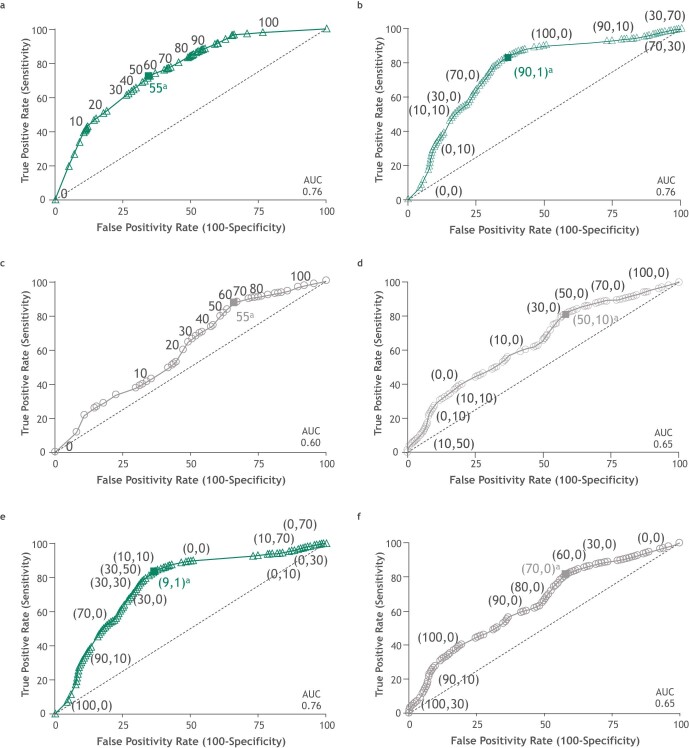
Extended Data Fig. 7. ROC curve analyses for regression and necrosis (PT) and combined %RVT plus necrosis (PT) in the path-evaluable patient population.
a, ROC curve analysis of 2-year EFS rate by %regression-PT for patients treated with nivolumab plus chemotherapy. AUC = 0.76, similar to that for %RVT-PT. b, ROC curve analysis of 2-year EFS rate by %regression + necrosis-PT for patients treated with nivolumab plus chemotherapy; points are labeled as ‘(%regression-PT, %necrosis-PT)’. Addition of %necrosis-PT to %regression-PT did not increase AUC. c, ROC curve analysis of 2-year EFS rate by %regression-PT for patients treated with chemotherapy. d, ROC curve analysis of 2-year EFS rate by %regression + necrosis-PT for patients treated with chemotherapy; points are labeled as ‘(%regression-PT, %necrosis-PT)’. Considering necrosis may be a tumor-intrinsic parameter, it was combined with %RVT-PT in patients receiving nivolumab plus chemotherapy (e), and in patients receiving chemotherapy (f). However, %RVT + necrosis-PT did not greatly alter the AUC achieved with %RVT-PT alone. Points are labeled as ‘(%RVT-PT, %necrosis-PT)’. Nivolumab plus chemotherapy arm, n = 141; chemotherapy arm, n = 126. EFS denotes event-free survival; PT, primary tumor; ROC, receiver operating characteristic; RVT, residual viable tumor. aThe solid square is the optimal cutoff, which is the difference between the true positive rate and false positive rate over all possible cutoff values.

