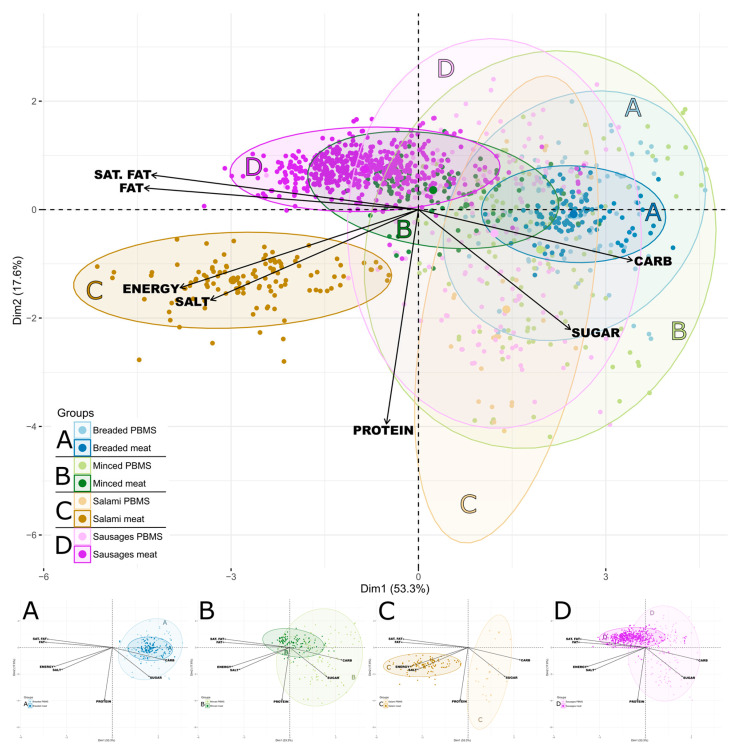
Figure 1.
Principal component analysis (PCA) biplot of the PBMS and corresponding meat products and sausages grouped among eight categories. Each point represents the considered energy and nutrient contents of one product. Arrows indicate the contribution of the energy and nutrients to the difference; sat. fat = saturated fat; carb = carbohydrate. Each ellipse represents a 95% confidence interval under normality assumption of the PCA scores. Small figures part A–D illustrate the categories extracted from the overall PCA.

