Why use Mindomo as your Gantt chart software?
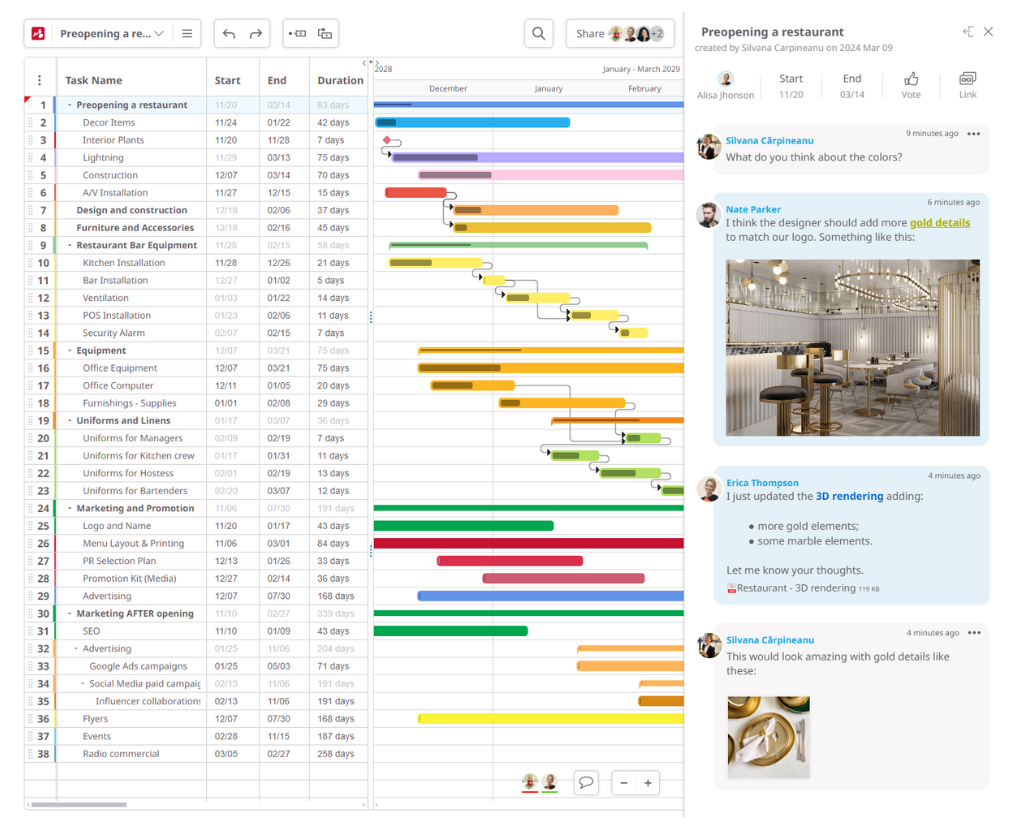
✓ Simple & Easy to use tool. Its power consists of simplicity: a simple solution to organize complex projects. Mindomo’s interface offers one clear side where you can add your tasks and all the necessary details and another side for a timeline that helps you visualize the upcoming activities in colorful bars, making it easier to track progress.
✓ Mindomo is more than a regular project management tool: You can instantly turn your Gantt files into mind maps or outlines, using the same diagram maker. Moreover, you can start planning your project in a mind map format (for example, do a brainstorming session) and then transform it into a Gantt framework with one click.
✓ Real-time collaborative Gantt chart maker: share and sync your work with any team member easily and immediately. In addition, you can work in Mindomo online (from any browser) or offline (Desktop app) and sync all the adjustments instantly.
✓ Suitable for complex projects: Mindomo’s Gantt chart includes all the tasks and milestones, an up-to-date timeline, the exact order of activities, completion and priorities levels, and the task assignees.
Structure your tasks: plan and schedule your activities
“How do you eat an elephant? One bite at a time.” As this popular quote says, to achieve it, you should divide a big goal into actionable steps.
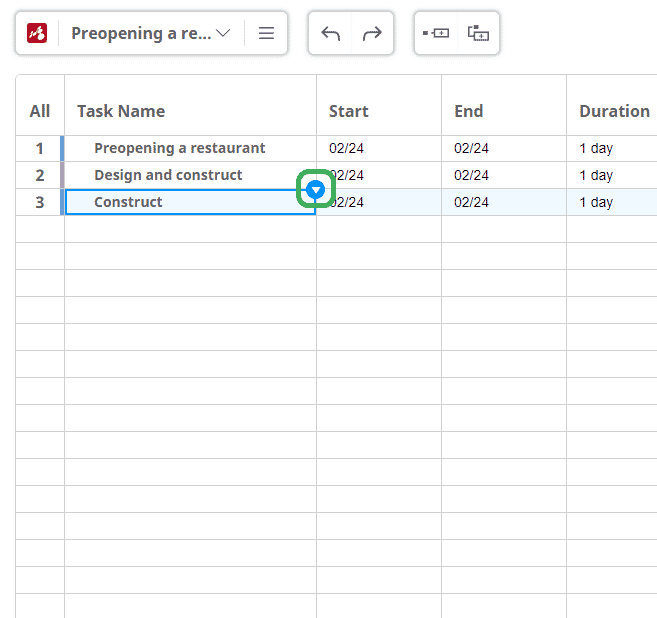
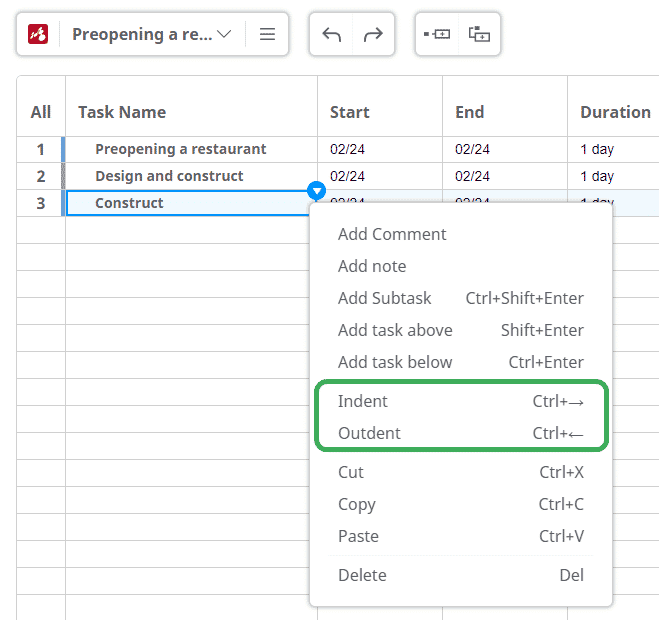
You can add and move the tasks very easily by dragging and dropping them in the project timeline. Structure the tasks hierarchically using the Indent and Outdent features.

A big advantage is the interchangeable view mode. If you start the planning process in a map format, you can switch to a Gantt framework anytime. And this goes both ways - you begin by creating a Gantt file, yet you can view your work as a mind map or outline.

Real-time Collaboration
How do you manage multiple tasks effectively? First, you prioritize them based on urgency and importance.
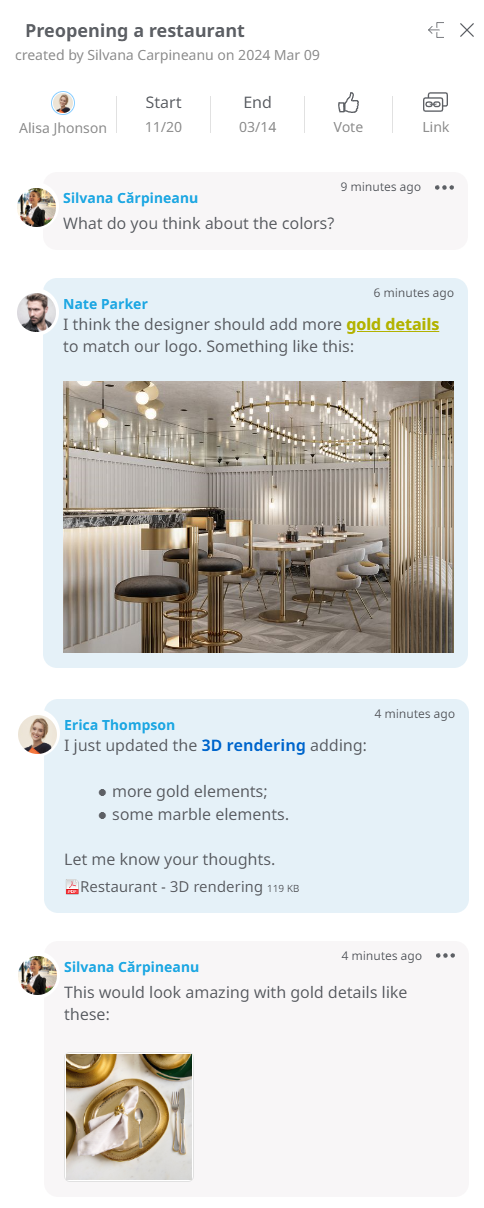
Second, you facilitate real-time, proactive collaboration between team members.
- Use the comments section to discuss, attach documents, links, images, and videos, and vote for the ideas you like best.
- You can also email an important comment to one of your collaborators.
- Make the most out of the live chat room to give timely feedback.
- All your team members can see the document changes in real-time.
On-project collaboration in Mindomo supports the critical path method, and even the most elaborate projects become easier to manage.
Keeping project progress on track
As a project manager, you have to keep an eye on the evolution of all activities. Track the progress of each task and each team member.
Besides the live editing feature, Mindomo helps you monitor the amount of time spent on completing the tasks and subtasks.
You can sync every task with the calendar application that you prefer. This way, it’s even more straightforward to track activities and their progress.
Thanks to the full history of changes, you can see exactly who did what and when. Therefore, assessing individual and team performance becomes easier.

Key components of a Gantt chart program
Mindomo’s Gantt chart looks very fresh and easy to use. If you are familiar with project management, you have experience with tools like Microsoft Project. But if you have never used project management software, working in Mindomo is the ideal starting option.
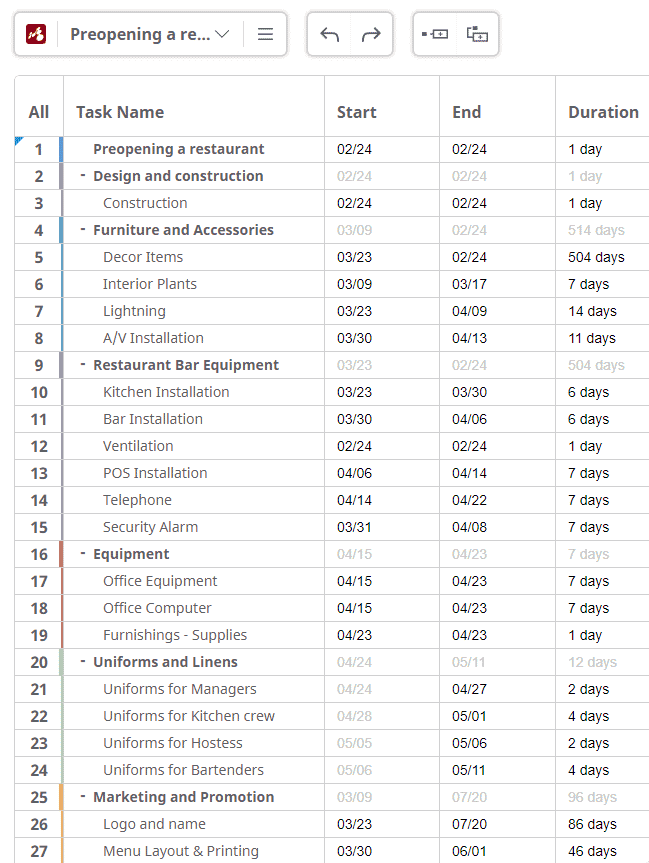
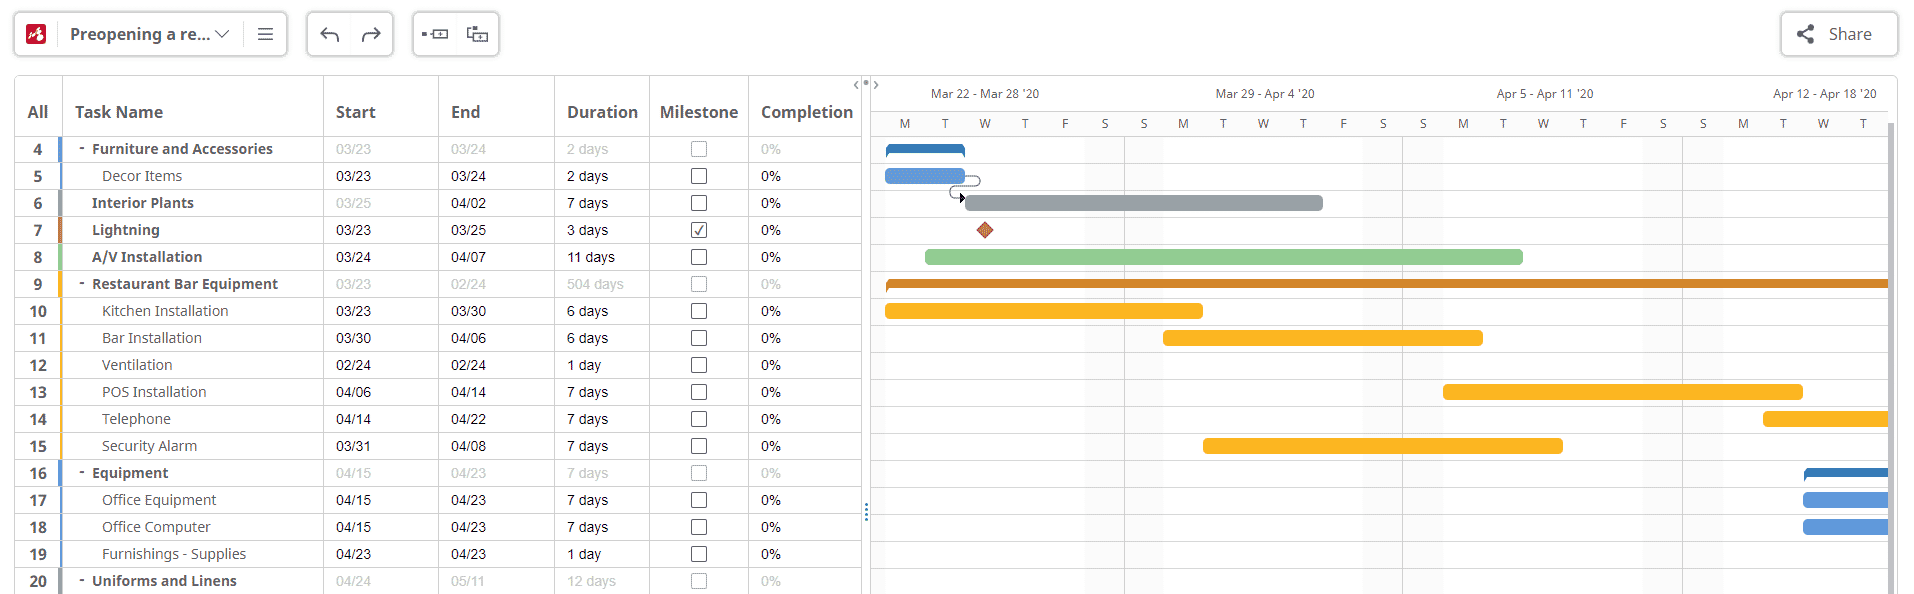
The Gantt chart has two main sections. On the right side, you will find the task list, along with some details about them. On the left side, there is a graphical illustration of the duration and progress of each task.
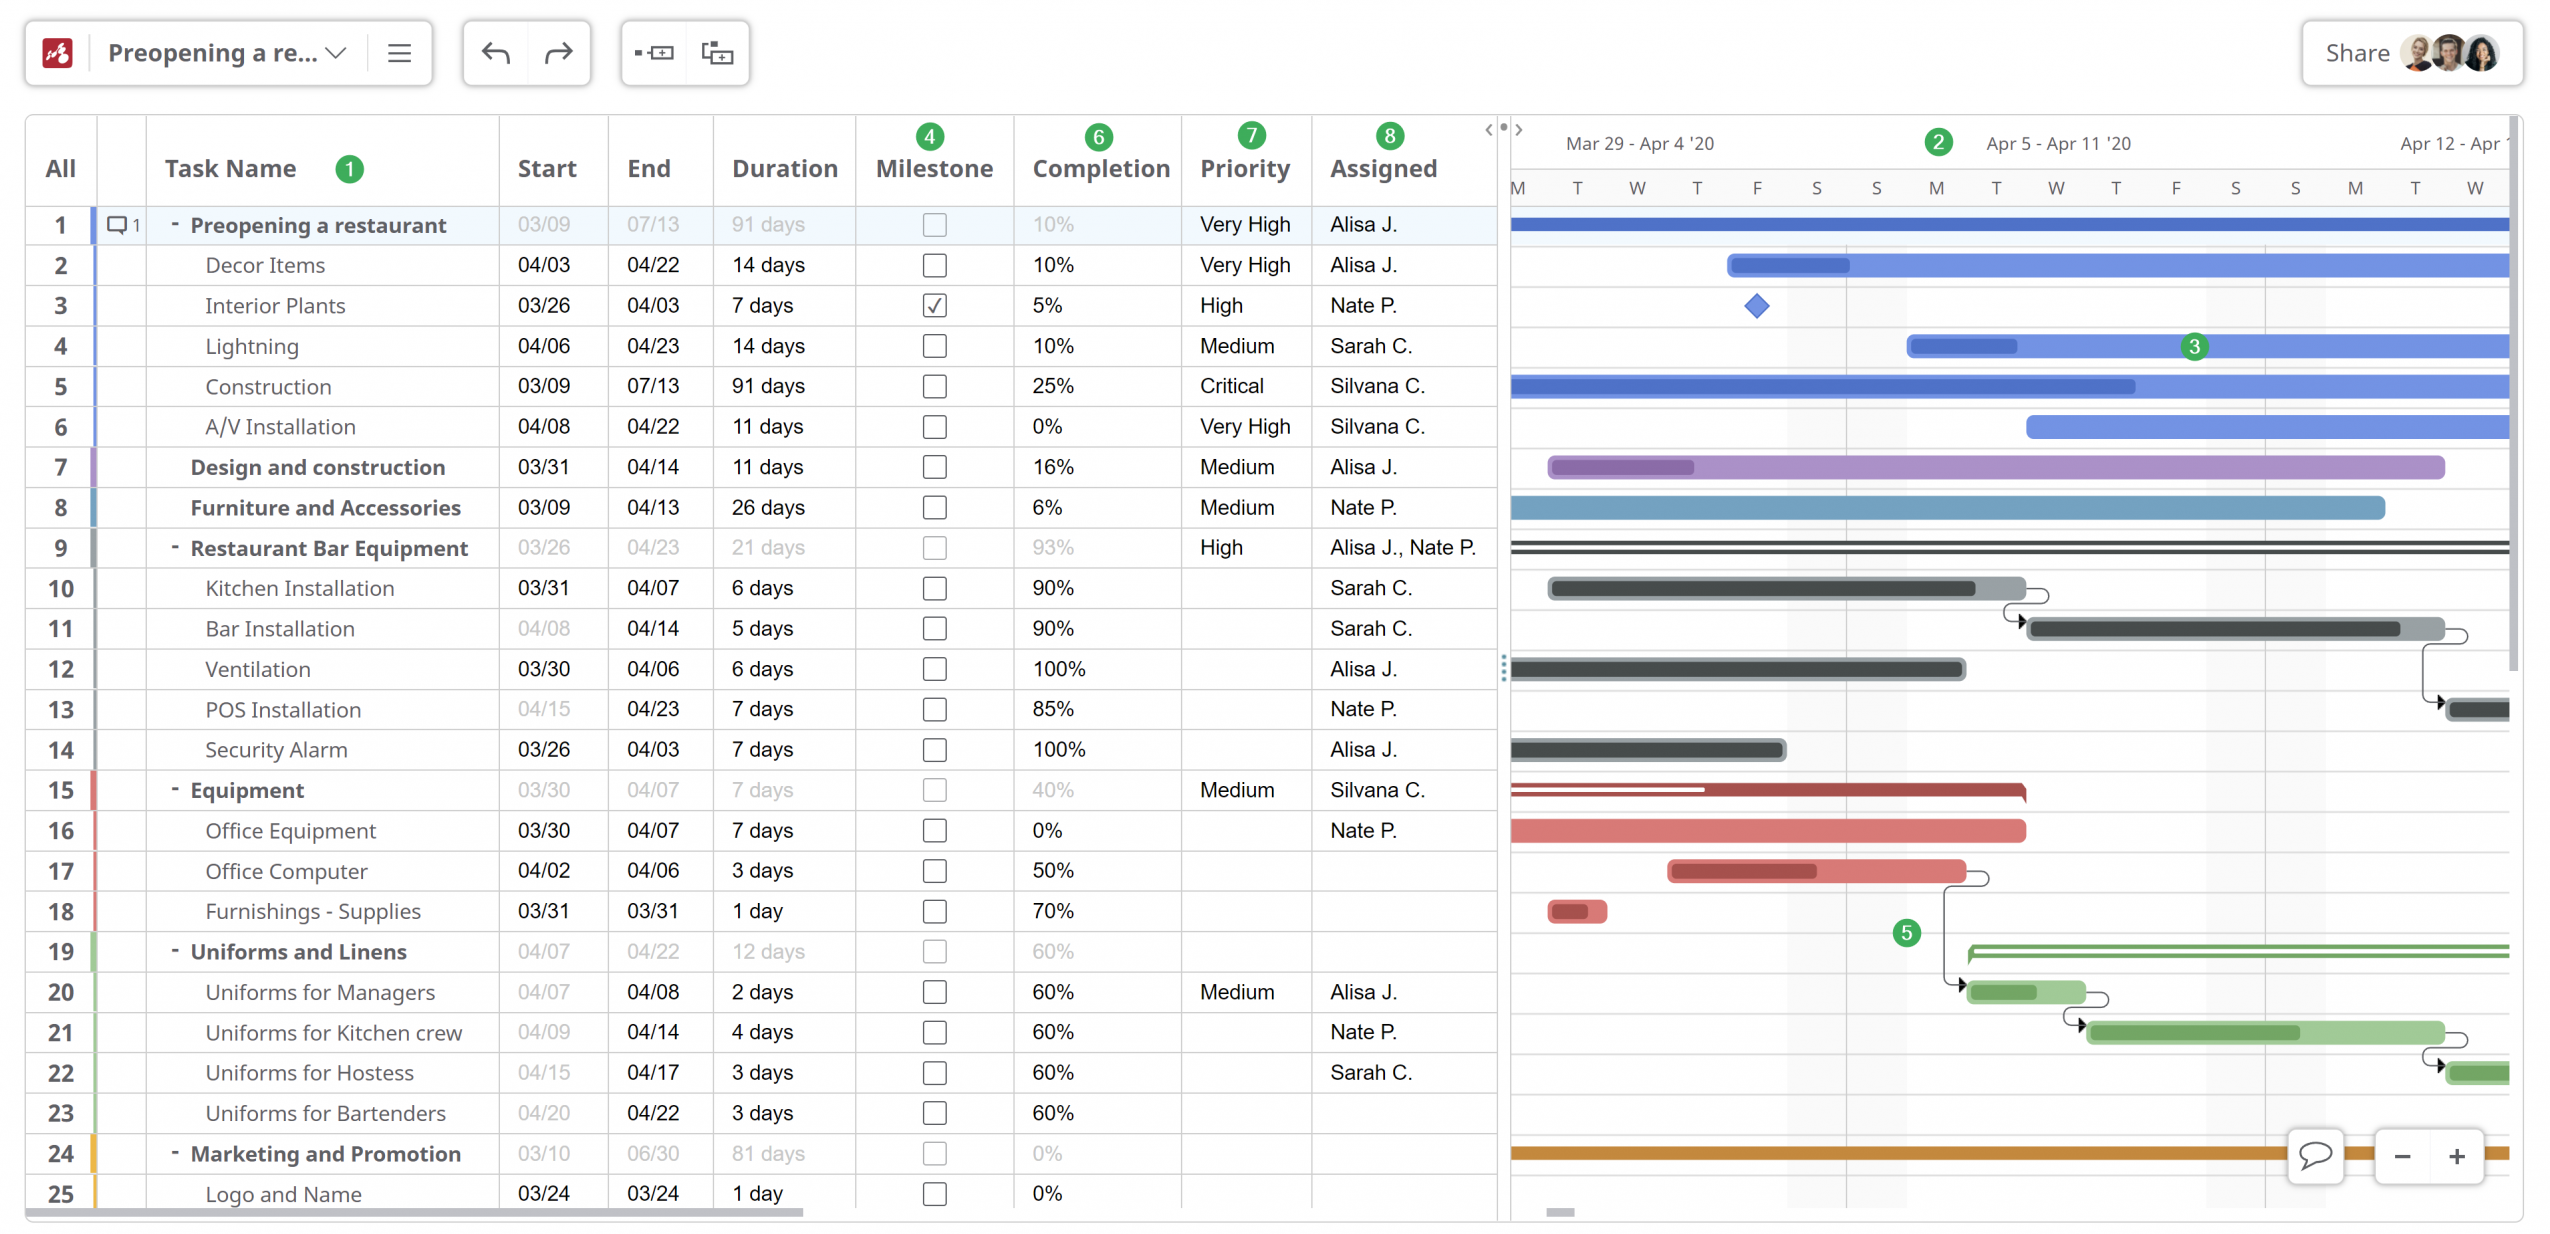
1. Task list
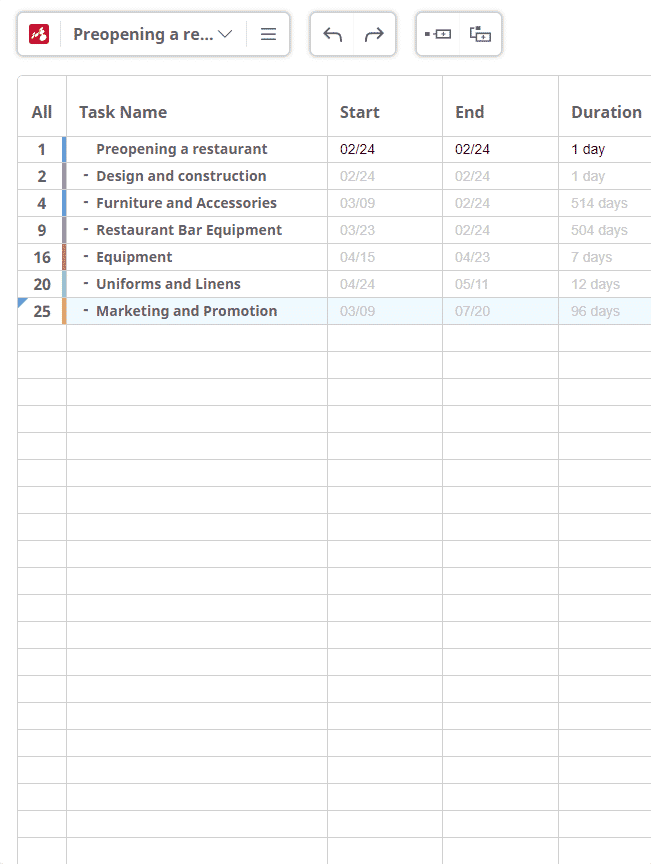
Large projects always have many tasks and subtasks. On the chart's left side, you will build your task hierarchy. You can organize tasks in groups and subgroups.
2. Project Timeline
It is found on the right side, running horizontally at the top of the Gantt chart. You can see the days, weeks, months, and years, covered in your project. The taskbars make it clear when each task starts/ends.
3. Bars
On the right side of the Gantt file, alongside each task, there is a bar. This will show the due dates, duration, and dependence on another task. You can edit those details by dragging and dropping them across the chart.
4. Milestones
In the Gantt file, milestones are displayed as diamonds. They represent major events, decisions, or anything important. Their completion offers a sense of satisfaction, so visualizing them serves as motivation. From the dedicated column, quickly check off any task that is a milestone.
5. Task dependencies
The tasks and related subtasks represent the actionable steps necessary for project completion. Consequently, successful project management relies on the exact order in which those steps must be completed.
6. Progress/Completion
A task is accomplished within a defined period or by a specific deadline. Its subtasks also have a defined start and end date or a deadline. Use the "Completion" column to mark percentages for each task's progress level. Any change of percentages in the subtasks will automatically calculate the completion of the main task.
7. Priority
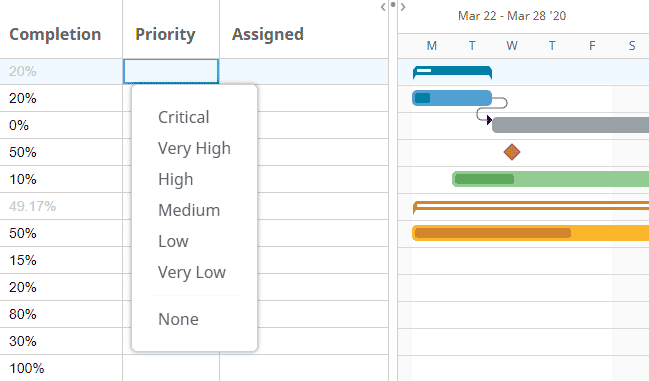
When establishing project tasks and subtasks, you can indicate the priority level of each activity. Choose a suitable level from the following: critical, very high, high, medium, low, very low, or none.
8. Task assignment
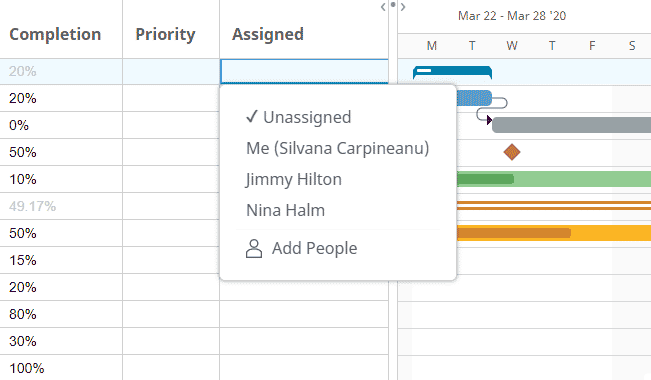
Use the "Assigned" column to set which team members are responsible for which activities. This way, everyone on the project will know what to do. The assignee will be notified via email about their assigned task(s).
Online vs Offline Gantt chart creation
Achieving goals in a rapidly changing environment demands flexibility and several time-saving hacks. Mindomo’s online Gantt chart software supports a variety of time management techniques to increase your productivity.
Mindomo has an online version that is accessible from any browser. While working online, all your documents are saved in the cloud. However, you can also make Gantt charts offline using the desktop version. The syncing functionality will merge the web version with the desktop editings.
An online Gantt creator seems to be the best option, but it’s important to have an offline option as well. With Mindomo you don’t have to choose one or the other, you have full flexibility to use both!
Select your favorite Desktop version:
Step-by-step online Gantt chart creation
A simple Gantt chart can provide a broad overview of multiple projects thanks to its visual bar chart representation of project timelines. As opposed to MS Project, which might feel too rigid, Mindomo is an easy-to-use online collaboration tool that also enables the creation of Gantt charts.
Follow the next step-by-step guide and learn how to do it. Start by logging in from the website. Go to “Create” from your dashboard, and choose the Gantt framework:
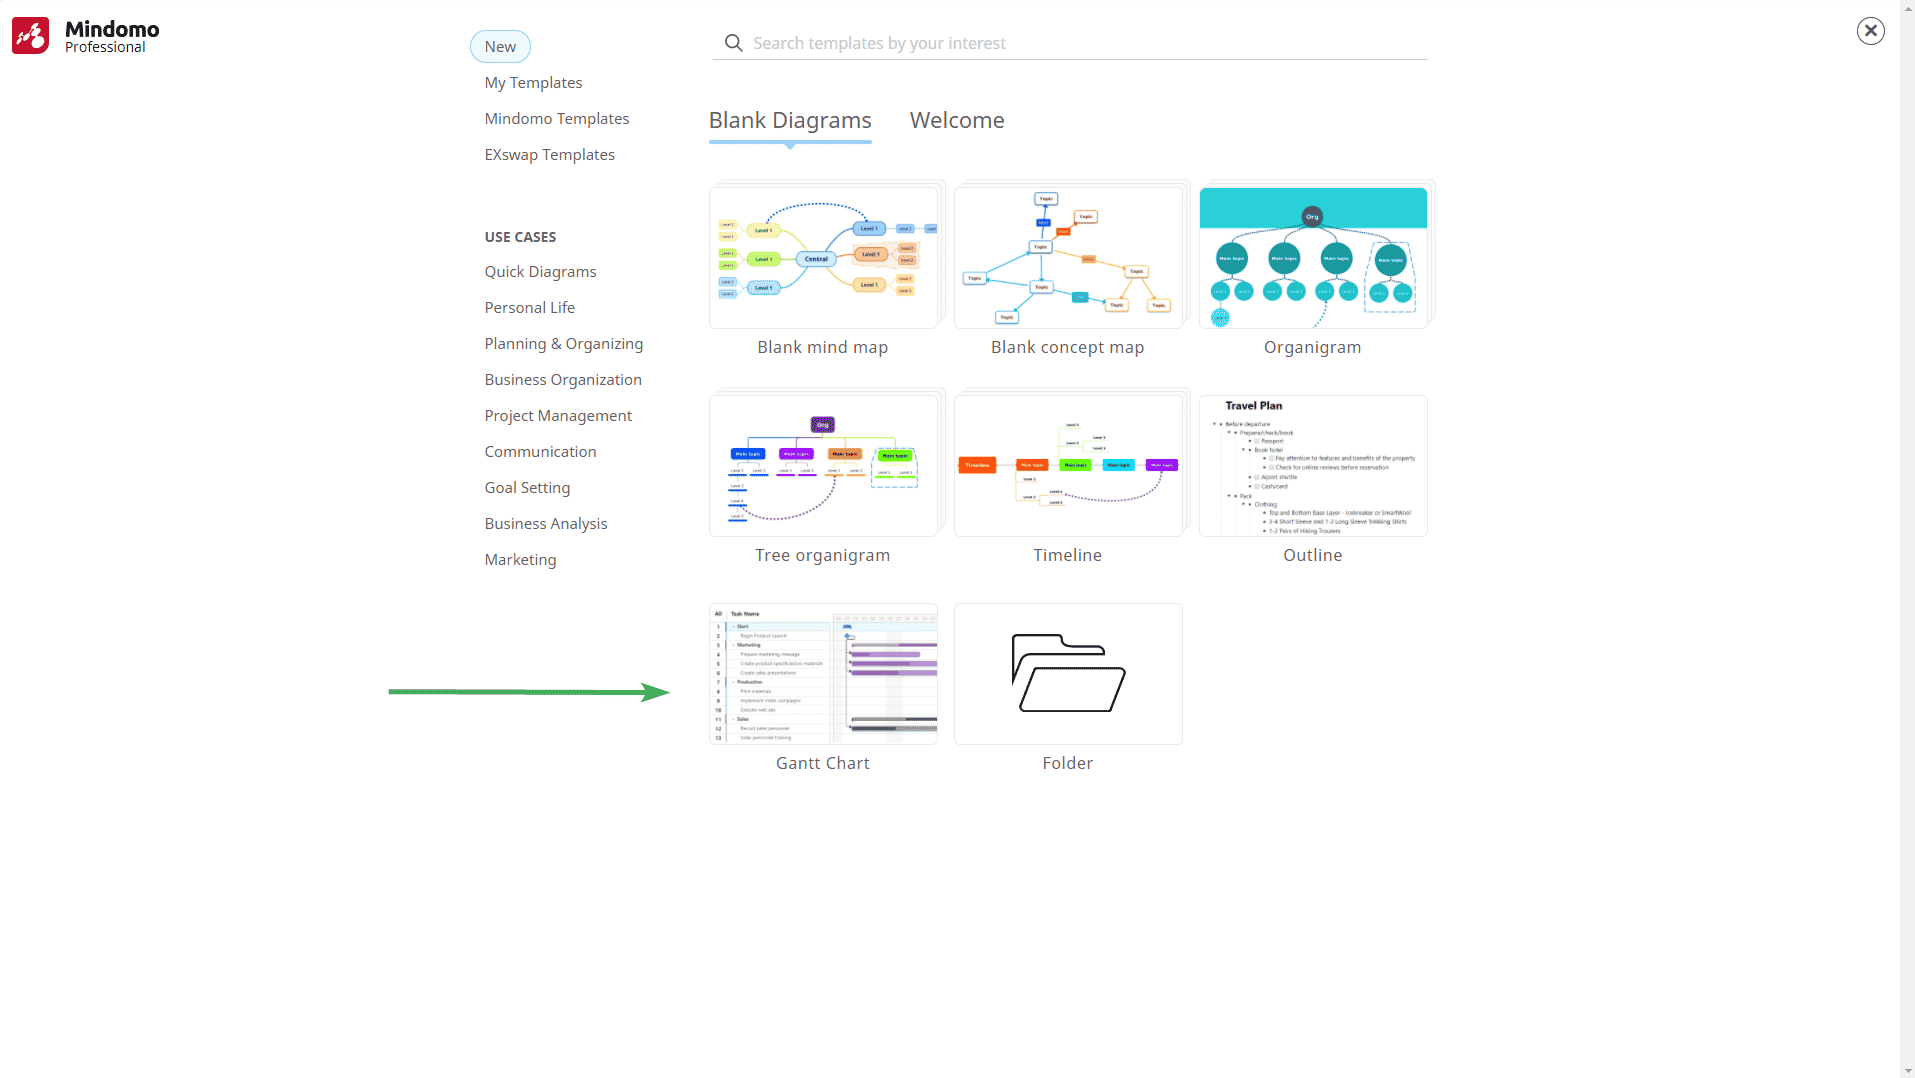
A new spreadsheet, both textual and visual, will appear and you can start planning your project from scratch:
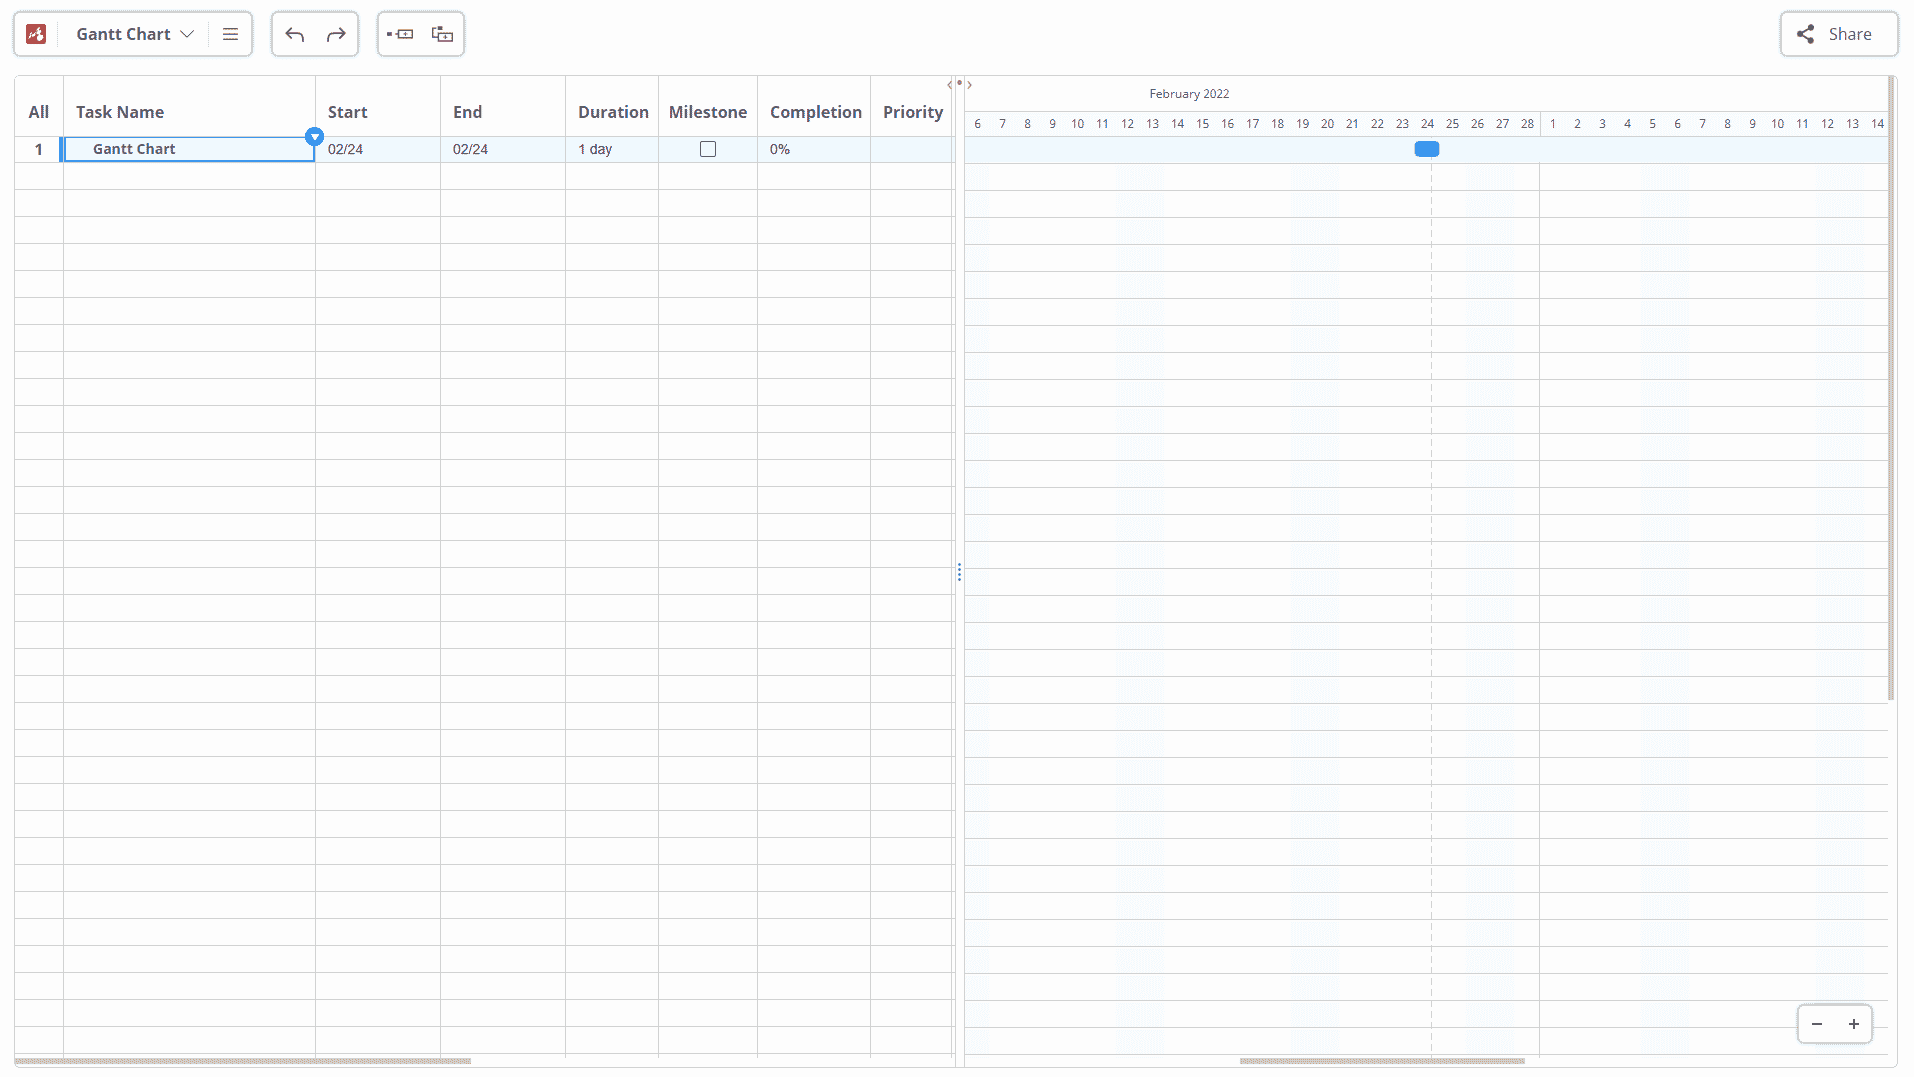
Create tasks
The task management is very simple: the main tasks will act as a summary. You can expand them to view the subtasks by clicking “+” next to it. When you click on “-” it will show only the main task.
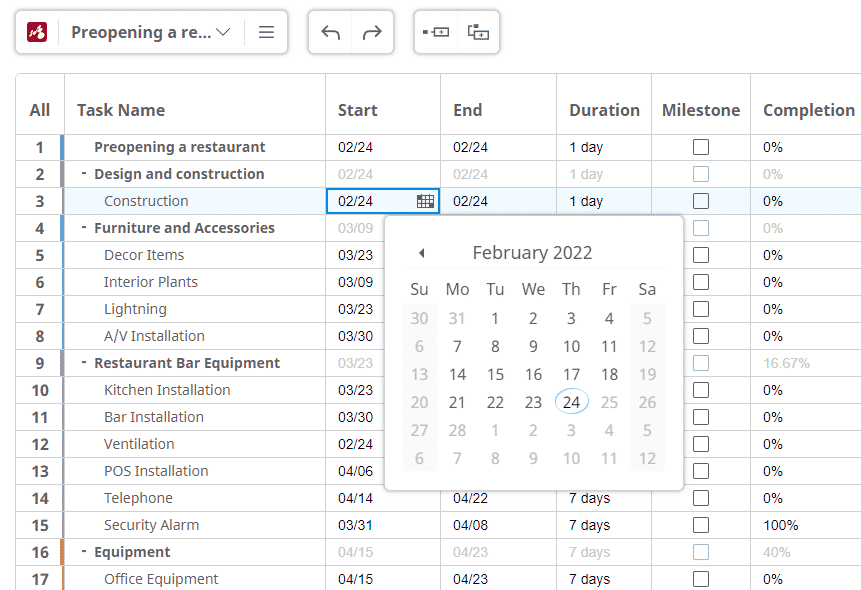
Setting start and end dates for each task
The third and fourth columns in the chart contain the start and end dates. You can select them using the calendar icon that appears when you click inside the cell.
However, you can also go to the next column which is called “Duration” and set the number of days for the activities. Once you do this, the taskbars from the right side of the chart will be modified automatically according to the period of time selected.
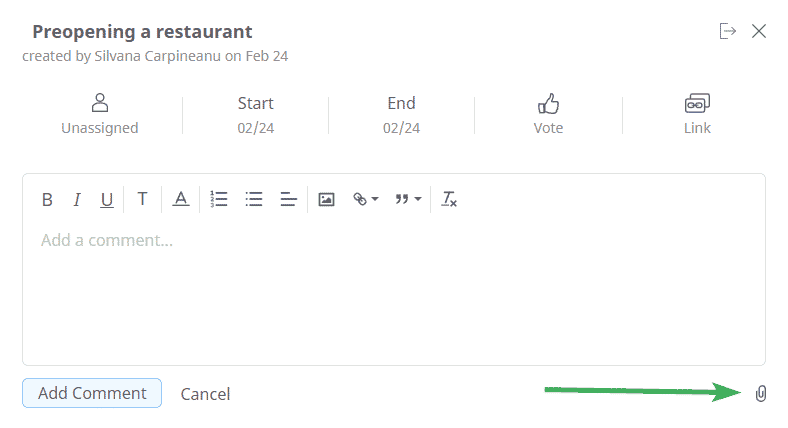
Add notes to your tasks
The management tool allows you to add a note to every task. Click the task number and a text box will appear on your screen. The notes are a perfect place to write extra information - suggestions, quick ideas, questions, etc.
You can be creative and add pictures or videos as note attachments. It can help your team understand the tasks better.
Add dependencies to improve your workflow
Once you set the tasks, it’s time to establish the connections between them. How completing a task influences the beginning of another activity.
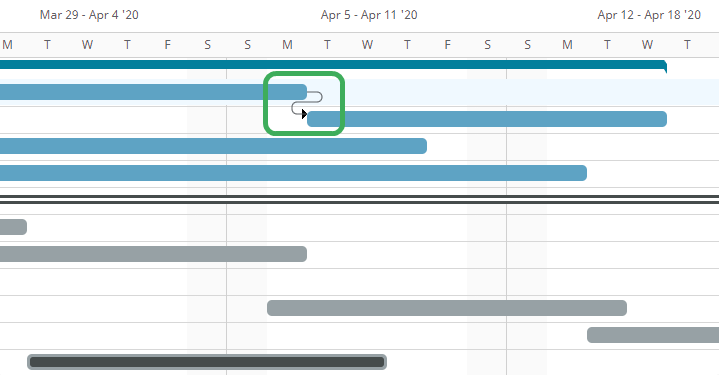
Hover over a task, then click on the black dot next to it (left/right). Then drag it and link it to the one you want to connect. An arrow connecting the two tasks will appear, making it more obvious which task is the predecessor and which is the successor.
See major dates or deliverables at a glance
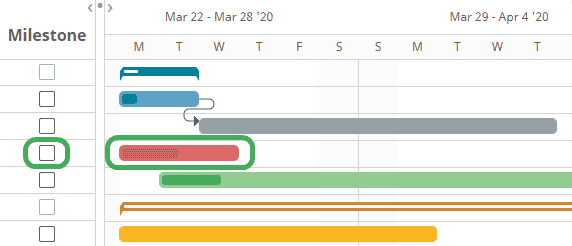
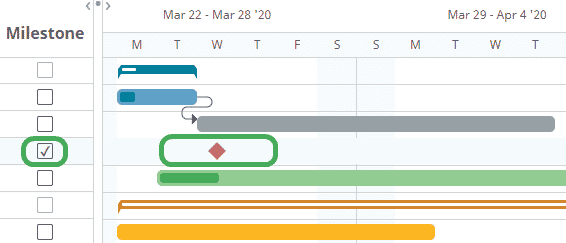
From the “Milestones” column, check off the tasks that are key markers for project success. Once checked off, the taskbar will be automatically modified into a diamond, making the project’s roadmap more straightforward.
Consequently, your graphic will look like this:
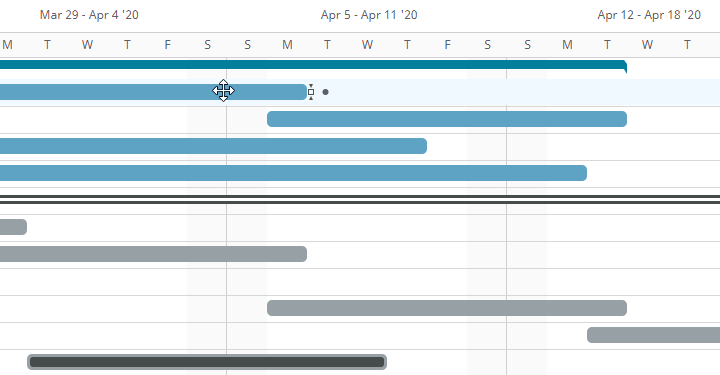
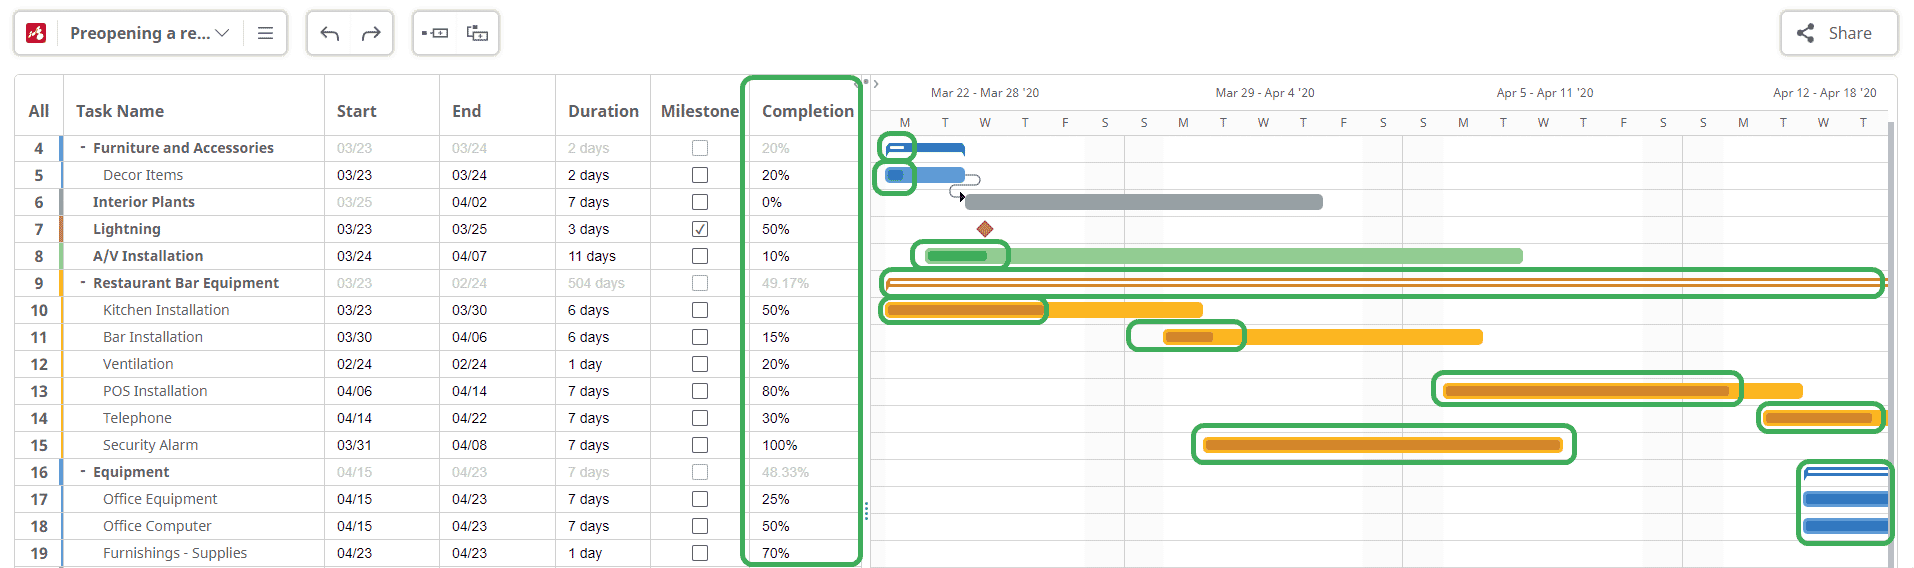
Update the completion level of your tasks
Manually add completion percentages for tasks. When you edit the completion percentage of a subtask, the tool automatically calculates the completion of the main task.
The main task’s progress bar will update depending on the overall completion. Updates are visible inside the blue rectangle, completed tasks and subtasks are represented with white, while the darker shade of blue shows the extent of tasks and subtasks that still need completion.
Set task priority levels
Assign tasks
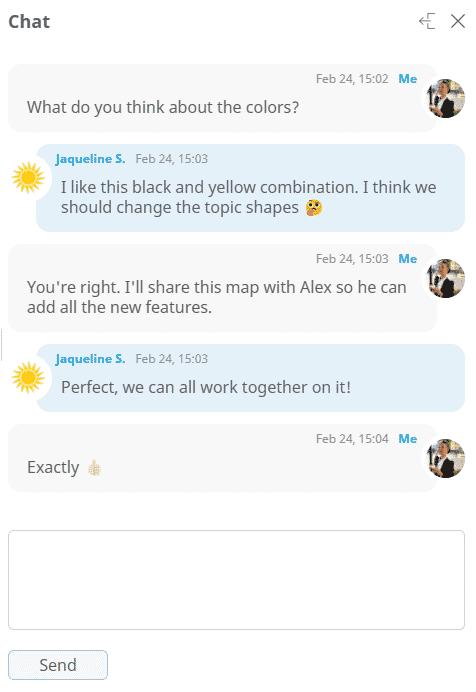
Connect live with your team members
One of Mindomo’s best features is that everything you change in the chart is instantly shared with your team. These real-time changes will improve collaboration and productivity.
Whenever a team member joins the chart, you are notified in the bottom right corner of the screen. Use the built-in chat to engage real-time with your colleagues and facilitate meaningful decision-making.

Turn diagrams into Gantt charts and vice-versa
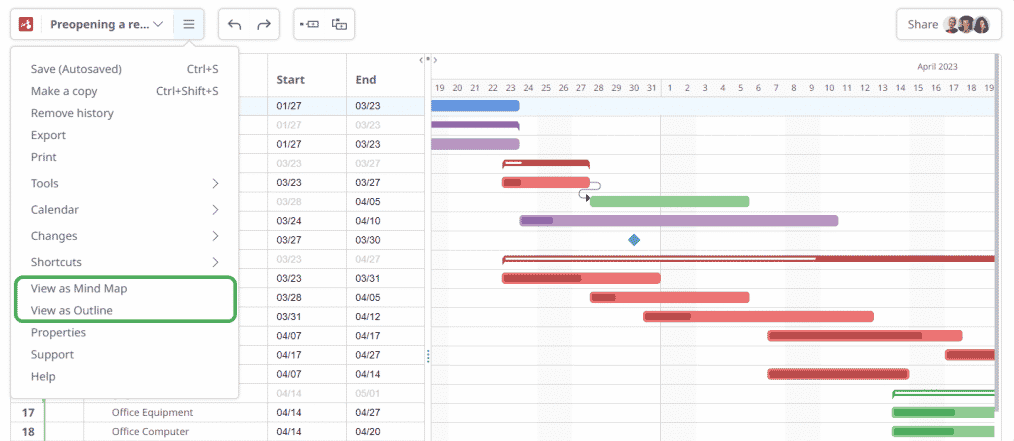
With Mindomo, you can turn your Gantt file into a mind map (read more about what is a mind map) or an outline. To do that, go to the File Menu and choose one of the options:
➤ View as mind map
➤ View as outline
Having a versatile view mode will help you save precious time - you won’t need to constantly switch from one mind map software to a Gantt charts program.
Check out the following video for more details, tips and tricks to create Gantt charts with ease:
Easy project management with Mindomo
Plan and schedule your activities, collaborate with your team, and monitor the progress in one single program. The simpler the software is, the better for you and everyone involved.
Go to Mindomo’s website and sign up. You will be able to visualize, implement, and monitor projects of any complexity.