Numbers
Numbers User Guide for Mac
- Welcome
- What’s new
-
- Get started with Numbers
- Intro to images, graphs and other objects
- Create a spreadsheet
- Open or close spreadsheets
- Personalise templates
- Use sheets
- Undo or redo changes
- Save your spreadsheet
- Find a spreadsheet
- Delete a spreadsheet
- Print a spreadsheet
- Change the sheet background
- Touch Bar for Numbers
-
- Use iCloud with Numbers
- Import an Excel or text file
- Export to Excel or another file format
- Reduce the spreadsheet file size
- Save a large spreadsheet as a package file
- Restore an earlier version of a spreadsheet
- Move a spreadsheet
- Lock a spreadsheet
- Password-protect a spreadsheet
- Create and manage custom templates
- Copyright

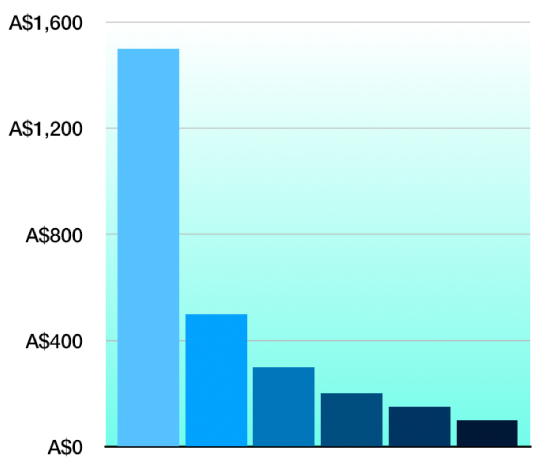
Add a border and background to a graph in Numbers on Mac
You can add a border and a background colour to any 2D bar, column, area or scatter plot.
Click the graph, then in the Format
 sidebar, click the Graph tab.
In the Graph Options section of the sidebar, select the Border tick box.
To add a background colour to the graph, or to choose a style and colour for the border, click the disclosure arrow next to Background & Border Style, then use the controls in that section.
You can also add a border around your sheet. To learn more, see Add a border around a sheet.
Thanks for your feedback.