Use video scopes in Final Cut Pro for iPad
You can use video scopes to get exact measurements of the luma and chroma levels of your clips and make more informed color correction decisions.
Video scopes appear next to the image in the viewer and provide a visual representation of the colors in a clip. The three video scopes included in Final Cut Pro for iPad give you different options for measuring brightness and color levels in your clips.
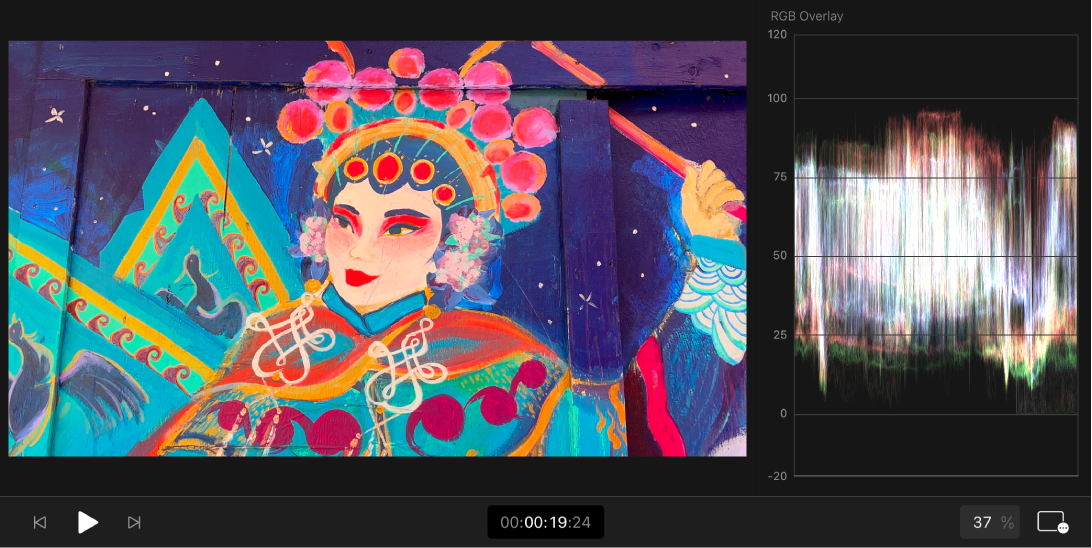
Use the waveform monitor
The waveform monitor provides a waveform display showing the relative levels of red, green, and blue in a clip.
In Final Cut Pro for iPad, open a project.
In the timeline, drag the playhead over a clip whose levels you want to check.
Tap
 below the viewer, tap Video Scope, then tap Waveform.
Values are displayed from left to right, mirroring the relative distribution of luma and chroma levels in the image. Spikes and dips in the displayed waveforms correspond to light and dark areas, and waveforms are tinted to match the color of items in the image.

The vertical axis measures brightness in IRE units. Zero represents reference black, or a 0% HLG code value. Values below 0 are sometimes referred to as super-black. 100 represents peak white, or a 100% HLG code value. Values above 100 are known as super-white.
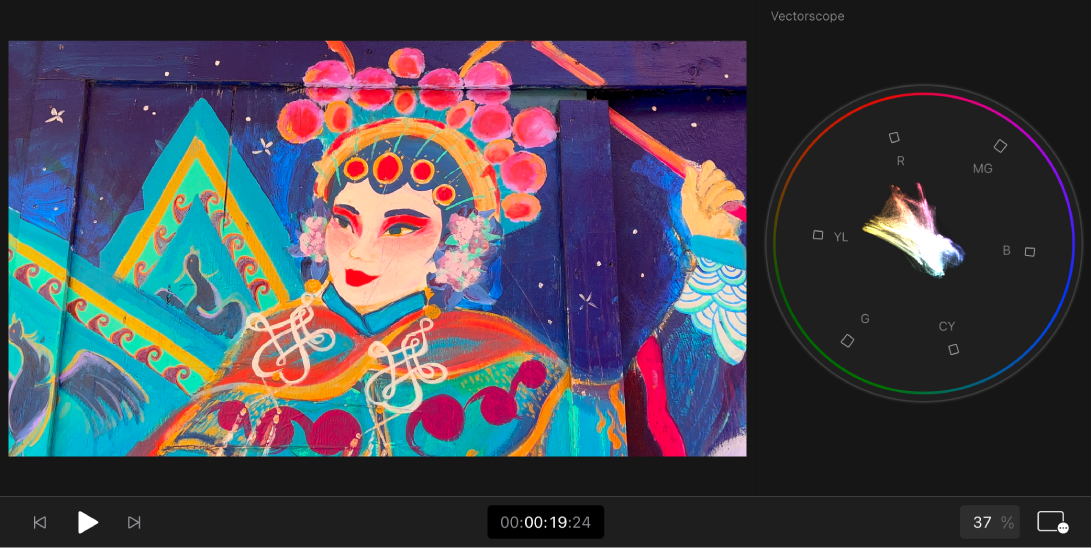
Use the vectorscope
The vectorscope shows the distribution of color on a circular scale, providing an at-a-glance view of the hue and intensity of colors in a clip. After you learn to identify the colors in your clips using the vectorscope, you can more easily see where two images differ and correct them so that they match as closely as possible.
In Final Cut Pro for iPad, open a project.
In the timeline, drag the playhead over a clip whose levels you want to check.
Tap
 below the viewer, tap Video Scope, then tap Vectorscope.
The color in the clip appears as a series of connected points that fall within the circular scale. The angle around the scale represents hue, with targets indicating the primary colors of red, green, and blue and the secondary colors of yellow, cyan, and magenta. The distance from the center of the scale to the outer ring shows saturation, with the center representing zero saturation and the outer ring representing maximum saturation.

Use the histogram
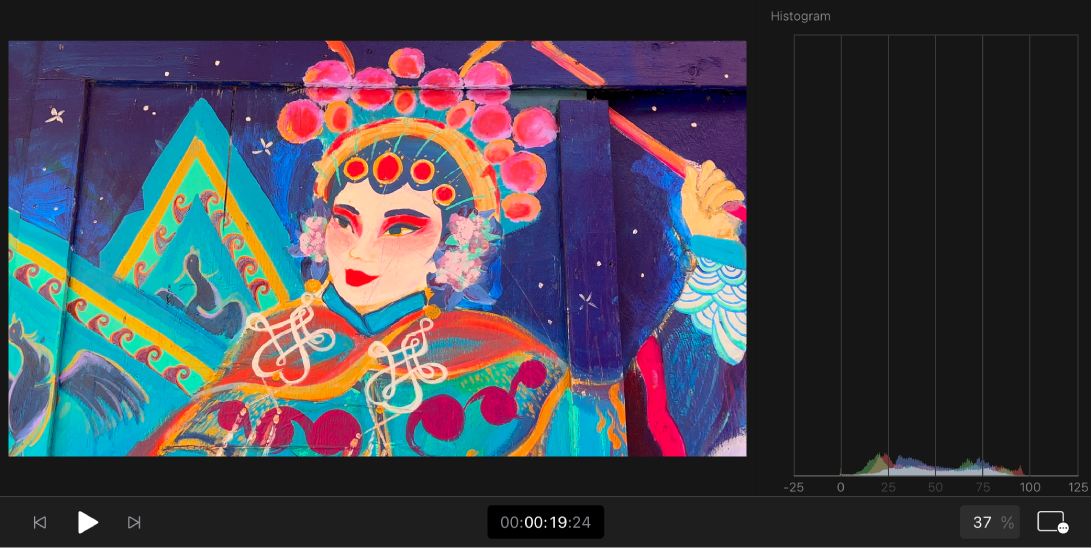
The histogram provides a statistical analysis of the image by calculating the total number of pixels of each color (red, green, or blue) and creating a graph that shows the number of pixels at each percentage of color.
In Final Cut Pro for iPad, open a project.
In the timeline, drag the playhead over a clip whose levels you want to check.
Tap
 below the viewer, tap Video Scope, then tap Histogram.
Each increment of the scale from left to right represents a percentage of color, and the height of each segment of the histogram graph shows the number of pixels that correspond to that percentage.

If the clip has equal levels of two or more colors, the colors are displayed as follows:
Equal levels of green and blue appear as cyan.
Equal levels of green and red appear as yellow.
Equal levels of red and blue appear as magenta.
Equal levels of red, green, and blue appear as gray.