Comparative Study
. 1999 Mar;73(3):2333-42.
doi: 10.1128/JVI.73.3.2333-2342.1999.

Comparison of the transcription and replication strategies of marburg virus and Ebola virus by using artificial replication systems

Affiliations
Comparative Study

Comparison of the transcription and replication strategies of marburg virus and Ebola virus by using artificial replication systems

E Mühlberger et al. J Virol. 1999 Mar.

Abstract

The members of the family Filoviridae, Marburg virus (MBGV) and Ebola virus (EBOV), are very similar in terms of morphology, genome organization, and protein composition. To compare the replication and transcription strategies of both viruses, an artificial replication system based on the vaccinia virus T7 expression system was established for EBOV. Specific transcription and replication of an artificial monocistronic minireplicon was demonstrated by reporter gene expression and detection of the transcribed and replicated RNA species. As it was shown previously for MBGV, three of the four EBOV nucleocapsid proteins, NP, VP35, and L, were essential and sufficient for replication. In contrast to MBGV, EBOV-specific transcription was dependent on the presence of the fourth nucleocapsid protein, VP30. When EBOV VP30 was replaced by MBGV VP30, EBOV-specific transcription was observed but with lower efficiency. Exchange of NP, VP35, and L between the two replication systems did not lead to detectable reporter gene expression. It was further observed that neither MBGV nor EBOV were able to replicate the heterologous minigenomes. A chimeric minigenome, however, containing the EBOV leader and the MBGV trailer was encapsidated, replicated, transcribed, and packaged by both viruses.


Figures
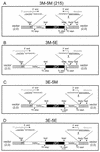
FIG. 1
FIG. 1
Construction of minigenomes. The minigenomes were inserted in the transcription vector 2,0 (gray segments) between the T7 RNA polymerase promoter (T7) and the hepatitis delta virus ribozyme (striped segments). (A) Diagram of MBGV-specific minigenome 3M-5M (previously designated 215), consisting of 106 nucleotides of the MBGV leader (white; lMBGV), 668 nucleotides of the CAT gene (black), and 439 nucleotides of the MBGV trailer (white). (B) Diagram of the chimeric minigenome 3M-5E consisting of 106 nucleotides of the MBGV leader (white; lMBGV), the CAT gene (black), and 731 nucleotides of the EBOV trailer (white). (C) Diagram of the chimeric minigenome 3E-5M consisting of 472 nucleotides of the EBOV leader (white), the CAT gene (black), and 439 nucleotides of the MBGV trailer (white). (D) Diagram of the EBOV-specific minigenome 3E-5E, consisting of 472 nucleotides of the EBOV leader (white), the CAT gene (black), and 731 nucleotides of the EBOV trailer (white). Above each scheme are indicated the boundary between the T7 RNA polymerase promoter sequence (underlined) and the 5′ ends of the minigenome (negative-sense orientation) (left side) and the boundary between the hepatitis delta virus ribozyme sequence (underlined) and the 3′ end of the minireplicon (negative-sense orientation) (right side). ClaI, NotI, NdeI, and RsrII, restriction enzymes used for cloning; SalI, restriction site used for linearization of the plasmids for in vitro transcription; TL start, translation start codon of the NP gene. Below, in smaller fonts, it is indicated whether the start site originates from NP of MBGV or EBOV. TC start, transcription start site of the NP gene of MBGV or EBOV; TC stop, transcription stop site of the L gene of MBGV or EBOV. The cleavage site of the ribozyme is symbolized by a pair of scissors.
FIG. 2
FIG. 2
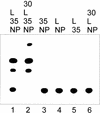
Reporter gene expression mediated by recombinant EBOV nucleocapsid proteins. HeLa cells were infected with MVA-T7; transfected with 500 ng of pT/NPEBO, 500 ng of pT/VP35EBO, 100 ng of pT/VP30EBO, and/or 1 μg of pT/LEBO; and subsequently transfected with RNA 3E-5E. At 3 days p.i., cells were lysed. CAT activity was determined, and acetylated products were separated by thin-layer chromatography. DNA transfection was performed with different combinations of nucleocapsid protein genes as indicated. NP, pT/NPEBO; 35, pT/VP35EBO; 30, pT/VP30EBO; L, pT/LEBO.
FIG. 3
FIG. 3
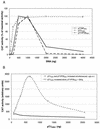
Characterization of the artificial EBOV replication system. HeLa cells were infected with MVA-T7 and subsequently transfected with plasmids encoding the nucleocapsid proteins. After DNA transfection, the cells were transfected with the in vitro-transcribed EBOV-specific minigenome RNA 3E-5E. At 3 days p.i. cells were probed for CAT activity and the amount of acetylated chloramphenicol was quantified with a BioImaging Analyzer (Fuji BAS-1000) with the Raytest TINA software. (A) Titration of plasmids encoding the different nucleocapsid proteins. Titration experiments were performed with fixed amounts of two of the plasmids encoding nucleocapsid proteins (500 ng of pT/NPEBO, 500 ng of pT/VP35EBO, and 1 μg of pT/LEBO) and various amounts of one of the plasmids as indicated in the legend. (B) Functional complex between L and VP35. HeLa cells were infected with MVA-T7 and subsequently transfected with 200 ng of pT/NPEBO and various amounts of pT/VP35EBO and pT/LEBO. The ratio between pT/LEBO and pT/VP35EBO was either held constant (4:1) and increased simultaneously, or only the amount of pT/LEBO was increased. In this case the amount of transfected pT/VP35EBO was 20 ng.
FIG. 4
FIG. 4
Characterization of RNA species synthesized by the artificial EBOV nucleocapsid complex. HeLa cells were infected with MVA-T7 and subsequently transfected with 500 ng of pT/NPEBO, 500 ng of pT/VP35EBO, and 2 μg of plasmid 3E-5E. One hundred nanograms of pT/VP30EBO and 1 μg of pT/LEBO were added to the transfection mixture as indicated. At 2 days p.i., cells were lysed. Lysates were either subjected to MCN digestion and subsequent RNA purification (A) or RNA was directly isolated from cell lysates and further purified by treatment with oligo(dT) cellulose (B). Purified RNA species were transferred onto nylon membranes and finally probed by using the negative-sense digoxigenin-labeled riboprobe DIG-BS/CAT (28). As a control, in vitro-transcribed positive-sense MBGV-specific minigenome 2.1-CAT was used (28) which is identical in size to 3M-5M. The arrows indicate the positions of positive-sense full-length RNA (A) or polyadenylated mRNA (B). NP, pT/NPEBO; 35, pT/VP35EBO; 30, pT/VP30EBO; L, pT/LEBO. (C) Influence of VP30 on CAT activity. HeLa cells were infected and transfected as described for Fig. 2. DNA transfection was performed with various amounts of pT/VP30EBO and fixed amounts of the other nucleocapsid protein genes (500 ng of pT/NPEBO, 500 ng of pT/VP35EBO, and 1 μg of pT/LEBO).
FIG. 5
FIG. 5
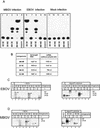
Replication and transcription of chimeric minigenomes. (A) E6 cells were infected with either MBGV (lanes 1 to 5) or EBOV (lanes 6 to 10) at an MOI of 0.1 PFU per cell or were not infected (Mock, lanes 11 to 15). Subsequently, cells were transfected with one of the in vitro-transcribed minigenomic RNAs. At 5 days p.i., cells were assayed for CAT activity. Transfected minigenomes are indicated below the panels. Control, no RNA transfection. (B) Table of the theoretical nucleotide numbers of the expected replicated or transcribed RNA species derived from the employed minigenomes. The mRNA nucleotide number is given without the poly(A) tail. nt, nucleotides. (C and D) Northern blot analysis of the different RNA species. (C) HeLa cells were infected with MVA-T7 and subsequently transfected with 500 ng of pT/NPEBO, 500 ng of pT/VP35EBO, 100 ng of pT/VP30EBO, and 2 μg of the respective minigenome DNA as indicated, with (+) or without (−) 1 μg of pT/LEBO. At 3 days p.i., cells were lysed. Total RNA was either purified after MCN digestion (left side), or RNA was purified without MCN digestion and further treated with oligo(dT) cellulose (right side). Purified RNA was analyzed by Northern hybridization with the negative-sense digoxigenin-labeled riboprobe DIG-BS/CAT (28). (D) HeLa cells were infected with MVA-T7 and subsequently transfected with 100 ng of pT/NPMBG, 500 ng of pT/VP35MBG, and 2 μg of the respective minigenome DNA as indicated, with (+) or without (−) 1 μg of pT/LMBG. RNA purification was performed as described for Fig. 5C. Control, in vitro-transcribed positive-sense MBGV-specific minigenome 2.1-CAT (see Fig. 4). The arrows indicate the specific RNA species.
FIG. 6
FIG. 6
Exchange of EBOV VP30 by MBGV VP30. HeLa cells were infected with MVA-T7 and transfected with DNA and RNA as described under Fig. 2. At 2 days p.i., the cell lysates were analyzed for CAT activity. DNA transfection was performed with the following plasmids: 500 ng of pT/NPEBO, 500 ng of pT/VP35EBO, and 1 μg of pT/LEBO; pT/VP30MBG and pT/GFP were added as indicated in the figure. As a negative control, pT/LEBO was omitted (negative control). For RNA transfection, minigenome 3E-5E was used. For the CAT assay, 1.5 μl of each cell lysate (except lane 3) was used. For the sample shown in lane 3, only a fifth of this amount was subjected to CAT assay. After quantification, the obtained value for the sample shown in lane 3 was multiplied by five and set as the maximal CAT activity (100%). −, DNA transfection with pT/NPEBO, pT/VP35EBO, and pT/LEBO.

Similar articles

Cited by

References

    1. Banerjee A K, Barik S. Gene expression of vesicular stomatitis virus genome RNA. Virology. 1992;188:417–428. - PubMed
    1. Becker S, Mühlberger E. Co- and posttranslational modifications and functions of Marburg virus proteins. In: Klenk H-D, editor. Marburg and Ebola viruses. Berlin, Germany: Springer-Verlag; 1998. - PubMed
    1. Becker S, Rinne C, Hofsäss U, Klenk H-D, Mühlberger E. Interactions of Marburg virus nucleocapsid proteins. Virology. 1998;249:406–417. - PubMed
    1. Becker S, Klenk H-D, Mühlberger E. Intracellular transport and processing of the Marburg virus surface protein in vertebrate and insect cells. Virology. 1996;225:145–155. - PubMed
    1. Bowen E T, Lloyd G, Harris W J, Platt G S, Baskerville A, Vella E E. Viral haemorrhagic fever in southern Sudan and northern Zaire. Preliminary studies on the aetiological agent. Lancet. 1977;i:571–573. - PubMed

Publication types