

Quality assessment of whole genome mapping data in the refined familial spastic paraplegia interval on chromosome 14q
- PMID: 9847083
- PMCID: PMC310792
- DOI: 10.1101/gr.8.11.1216
Quality assessment of whole genome mapping data in the refined familial spastic paraplegia interval on chromosome 14q
Abstract
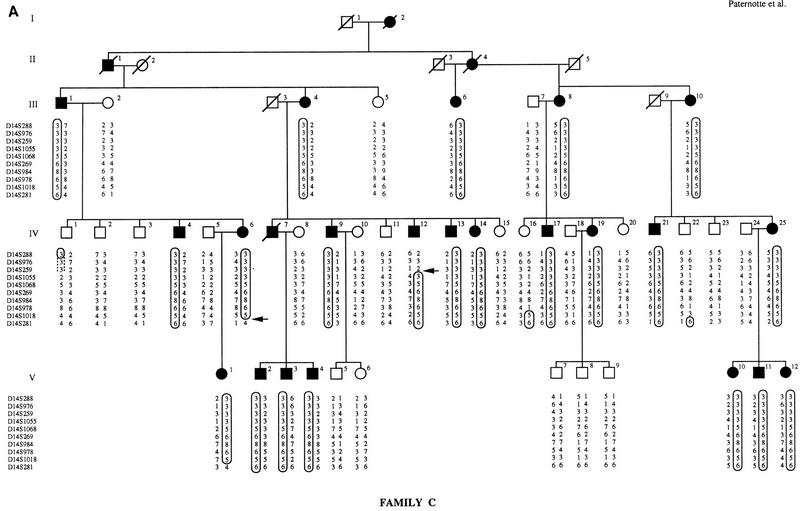
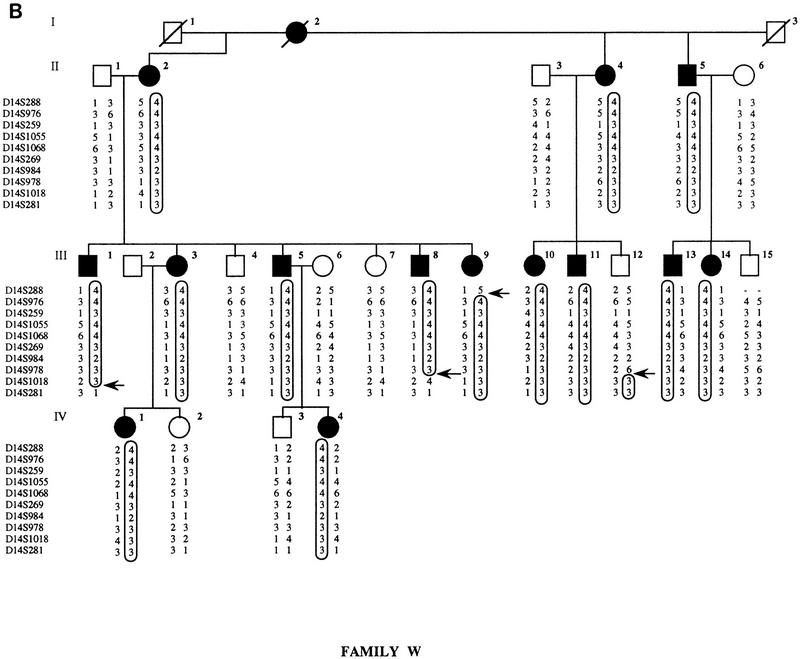
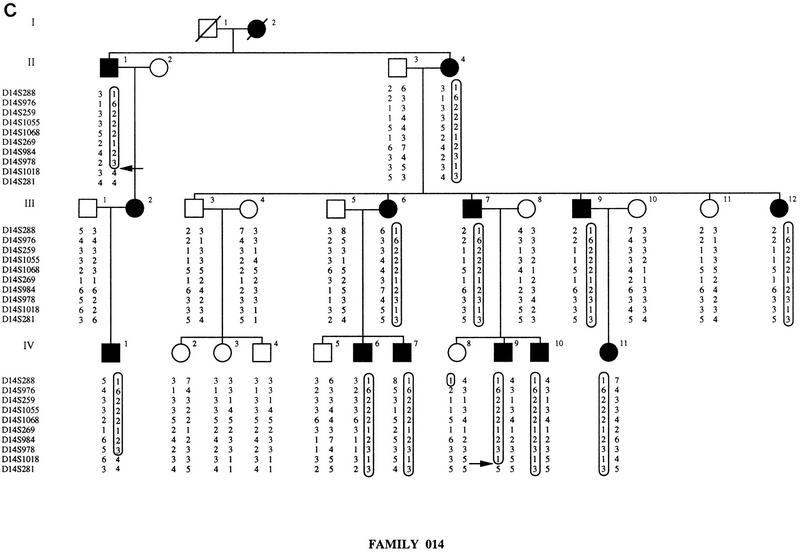
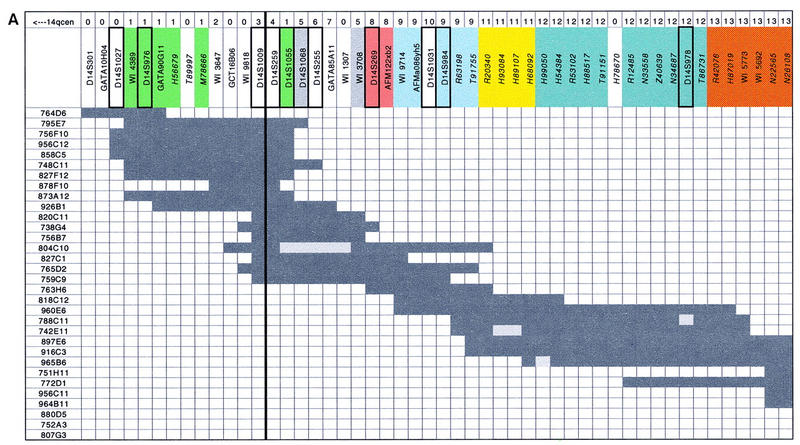
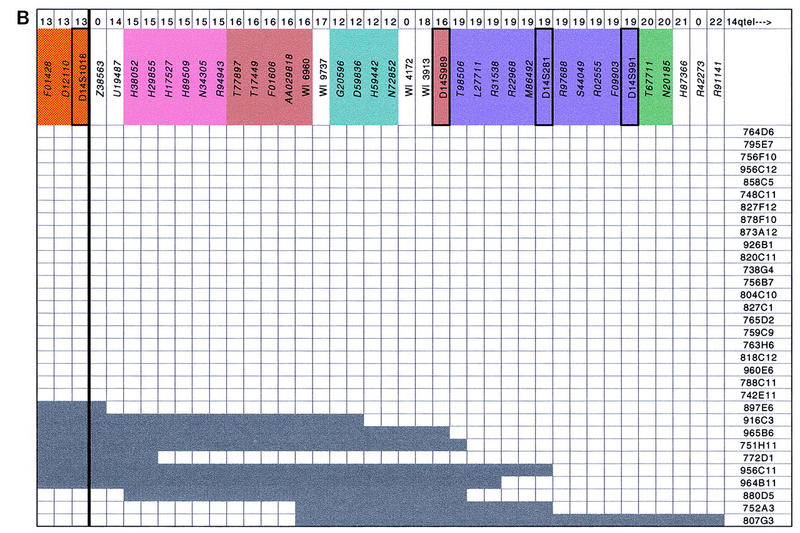
Autosomal dominant familial spastic paraplegia (AD-FSP) is a genetically heterogeneous neurodegenerative disorder characterized by progressive spasticity of the lower limbs. Three loci on chromosome 14q (SPG3), 2p (SPG4), and 15q (SPG6) were shown to be responsible for AD-FSP. Analysis of recombination events in three SPG3-linked families allowed us to narrow the critical interval from 9 to 5 cM. An approximately 5-Mb YAC contig comprising 32 clones and 90 STSs was built from D14S301 to D14S991, encompassing this region of 14q21. Fifty-six ESTs assigned previously to this region with radiation hybrid (RH) panels Genebridge 4 and G3 were precisely localized on the YAC contig. The 90 STSs positioned on the contig were tested on the TNG RH panel to compare our YAC-based map with an RH map at a high level of resolution. Comparison between our map and the whole genome mapping data on this interval of chromosome 14q is discussed.
Figures
Similar articles
-
A fine integrated map of the SPG4 locus excludes an expanded CAG repeat in chromosome 2p-linked autosomal dominant spastic paraplegia.Genomics. 1999 Sep 15;60(3):309-19. doi: 10.1006/geno.1999.5932. Genomics. 1999. PMID: 10493830
-
Mapping of a complicated familial spastic paraplegia to locus SPG4 on chromosome 2p.J Med Genet. 1998 Feb;35(2):89-93. doi: 10.1136/jmg.35.2.89. J Med Genet. 1998. PMID: 9507385 Free PMC article.
-
Isolation of CAG/CTG repeats from within the chromosome 2p21-p24 locus for autosomal dominant spastic paraplegia (SPG4) by YAC fragmentation.Hum Genet. 1999 Sep;105(3):217-25. doi: 10.1007/s004390051092. Hum Genet. 1999. PMID: 10987648
-
Molecular genetics of familial spastic paraplegia: a multitude of responsible genes.J Neurol Sci. 1996 May;137(2):131-8. doi: 10.1016/0022-510x(95)00349-7. J Neurol Sci. 1996. PMID: 8782167 Review.
-
Advances in hereditary spastic paraplegia.Curr Opin Neurol. 1997 Aug;10(4):313-8. doi: 10.1097/00019052-199708000-00006. Curr Opin Neurol. 1997. PMID: 9266155 Review.
Cited by
-
Current status of human chromosome 14.J Med Genet. 2002 Feb;39(2):81-90. doi: 10.1136/jmg.39.2.81. J Med Genet. 2002. PMID: 11836355 Free PMC article. Review.
-
Hereditary spastic paraplegia.Curr Neurol Neurosci Rep. 2006 Jan;6(1):65-76. doi: 10.1007/s11910-996-0011-1. Curr Neurol Neurosci Rep. 2006. PMID: 16469273 Review.
-
Early onset autosomal dominant spastic paraplegia caused by novel mutations in SPG3A.Neurogenetics. 2004 Dec;5(4):239-43. doi: 10.1007/s10048-004-0191-2. Epub 2004 Oct 28. Neurogenetics. 2004. PMID: 15517445
-
A new locus for autosomal dominant "pure" hereditary spastic paraplegia mapping to chromosome 12q13, and evidence for further genetic heterogeneity.Am J Hum Genet. 1999 Sep;65(3):757-63. doi: 10.1086/302555. Am J Hum Genet. 1999. PMID: 10441583 Free PMC article.
-
A locus for autosomal dominant "pure" hereditary spastic paraplegia maps to chromosome 19q13.Am J Hum Genet. 2000 Feb;66(2):728-32. doi: 10.1086/302783. Am J Hum Genet. 2000. PMID: 10677333 Free PMC article.
References
-
- Altschul SF, Gish W, Miller W, Myers EW, Lipman DJ. Basic local alignment search tool. J Mol Biol. 1990;215:403–410. - PubMed
-
- Bruyn RPM, van Veen MMM, Kremer H, Scheltens PH, Padberg GW. Familial spastic paraplegia: Evidence for a fourth locus. Clin Neurol Neurosurg. 1997;99:87–90. - PubMed
-
- Chardin P, Camonis JH, Gale NW, Van Aelst L, Schlessinger J, Wigler M H, Bar-Sagi D. Human Sos1: A guanine nucleotide exchange factor for Ras that binds to GRB2. Science. 1993;260:1338–1343. - PubMed
-
- Cohen D, Chumakov I, Weissenbach J. A first-generation physical map of the human genome. Nature. 1993;366:698–701. - PubMed
Publication types
MeSH terms
LinkOut - more resources
Full Text Sources
Miscellaneous