

The arabidopsis thaliana AGRAVITROPIC 1 gene encodes a component of the polar-auxin-transport efflux carrier
- PMID: 9844024
- PMCID: PMC24584
- DOI: 10.1073/pnas.95.25.15112
The arabidopsis thaliana AGRAVITROPIC 1 gene encodes a component of the polar-auxin-transport efflux carrier
Abstract
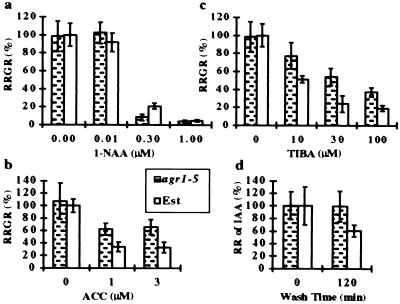
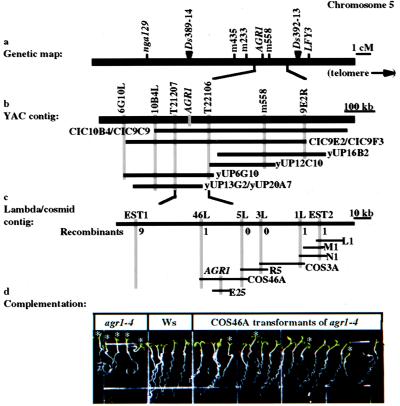
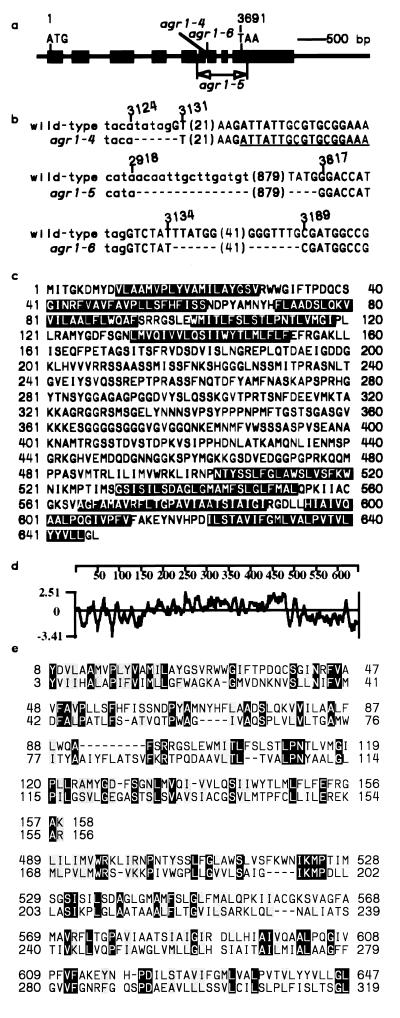
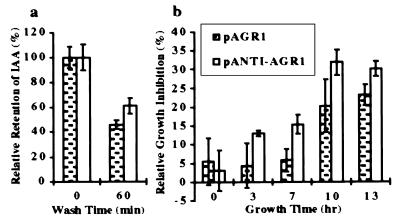
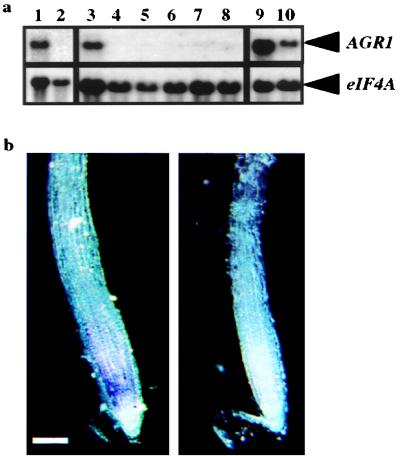
Auxins are plant hormones that mediate many aspects of plant growth and development. In higher plants, auxins are polarly transported from sites of synthesis in the shoot apex to their sites of action in the basal regions of shoots and in roots. Polar auxin transport is an important aspect of auxin functions and is mediated by cellular influx and efflux carriers. Little is known about the molecular identity of its regulatory component, the efflux carrier [Estelle, M. (1996) Current Biol. 6, 1589-1591]. Here we show that mutations in the Arabidopsis thaliana AGRAVITROPIC 1 (AGR1) gene involved in root gravitropism confer increased root-growth sensitivity to auxin and decreased sensitivity to ethylene and an auxin transport inhibitor, and cause retention of exogenously added auxin in root tip cells. We used positional cloning to show that AGR1 encodes a putative transmembrane protein whose amino acid sequence shares homologies with bacterial transporters. When expressed in Saccharomyces cerevisiae, AGR1 promotes an increased efflux of radiolabeled IAA from the cells and confers increased resistance to fluoro-IAA, a toxic IAA-derived compound. AGR1 transcripts were localized to the root distal elongation zone, a region undergoing a curvature response upon gravistimulation. We have identified several AGR1-related genes in Arabidopsis, suggesting a global role of this gene family in the control of auxin-regulated growth and developmental processes.
Figures
Similar articles
-
Complex regulation of Arabidopsis AGR1/PIN2-mediated root gravitropic response and basipetal auxin transport by cantharidin-sensitive protein phosphatases.Plant J. 2005 Apr;42(2):188-200. doi: 10.1111/j.1365-313X.2005.02369.x. Plant J. 2005. PMID: 15807782
-
EIR1, a root-specific protein involved in auxin transport, is required for gravitropism in Arabidopsis thaliana.Genes Dev. 1998 Jul 15;12(14):2175-87. doi: 10.1101/gad.12.14.2175. Genes Dev. 1998. PMID: 9679062 Free PMC article.
-
Molecular genetics of root gravitropism and waving in Arabidopsis thaliana.Gravit Space Biol Bull. 1998 May;11(2):71-8. Gravit Space Biol Bull. 1998. PMID: 11540641
-
Going the distance with auxin: unravelling the molecular basis of auxin transport.Philos Trans R Soc Lond B Biol Sci. 1998 Sep 29;353(1374):1511-5. doi: 10.1098/rstb.1998.0306. Philos Trans R Soc Lond B Biol Sci. 1998. PMID: 9800211 Free PMC article. Review.
-
Root gravitropism: a complex response to a simple stimulus?Trends Plant Sci. 1999 Oct;4(10):407-12. doi: 10.1016/s1360-1385(99)01472-7. Trends Plant Sci. 1999. PMID: 10498965 Review.
Cited by
-
Auxin Homeostasis and Distribution of the Auxin Efflux Carrier PIN2 Require Vacuolar NHX-Type Cation/H+ Antiporter Activity.Plants (Basel). 2020 Oct 3;9(10):1311. doi: 10.3390/plants9101311. Plants (Basel). 2020. PMID: 33023035 Free PMC article.
-
The plant hormone indoleacetic acid induces invasive growth in Saccharomyces cerevisiae.Proc Natl Acad Sci U S A. 2004 Mar 23;101(12):4153-7. doi: 10.1073/pnas.0400659101. Epub 2004 Mar 9. Proc Natl Acad Sci U S A. 2004. PMID: 15010530 Free PMC article.
-
Genetic regulation of vascular tissue patterning in Arabidopsis.Plant Cell. 1999 Nov;11(11):2123-37. doi: 10.1105/tpc.11.11.2123. Plant Cell. 1999. PMID: 10559439 Free PMC article.
-
An emerging model of auxin transport regulation.Plant Cell. 2002 Feb;14(2):293-9. doi: 10.1105/tpc.140230. Plant Cell. 2002. PMID: 11884675 Free PMC article. Review. No abstract available.
-
Variation in expression and protein localization of the PIN family of auxin efflux facilitator proteins in flavonoid mutants with altered auxin transport in Arabidopsis thaliana.Plant Cell. 2004 Jul;16(7):1898-911. doi: 10.1105/tpc.021501. Epub 2004 Jun 18. Plant Cell. 2004. PMID: 15208397 Free PMC article.
References
-
- Masson P H. BioEssays. 1995;17:119–127. - PubMed
-
- Lomax T L, Muday G K, Rubery P H. In: Plant Hormones-Physiology, Biochemistry, and Molecular Biology. Davies P J, editor. Dordrecht, The Netherlands: Kluwer; 1995. pp. 509–530.
-
- Bell C J, Maher E P. Mol Gen Genet. 1990;220:289–293.
-
- Okada K, Shimura Y. Science. 1990;250:274–276. - PubMed
Publication types
MeSH terms
Substances
Associated data
- Actions
Grants and funding
LinkOut - more resources
Full Text Sources
Other Literature Sources
Molecular Biology Databases
Miscellaneous
