Comprehensive identification of cell cycle-regulated genes of the yeast Saccharomyces cerevisiae by microarray hybridization
- PMID: 9843569
- PMCID: PMC25624
- DOI: 10.1091/mbc.9.12.3273
Comprehensive identification of cell cycle-regulated genes of the yeast Saccharomyces cerevisiae by microarray hybridization
Abstract
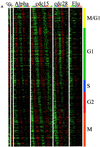
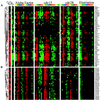
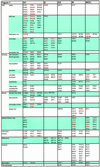
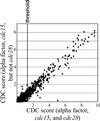
We sought to create a comprehensive catalog of yeast genes whose transcript levels vary periodically within the cell cycle. To this end, we used DNA microarrays and samples from yeast cultures synchronized by three independent methods: alpha factor arrest, elutriation, and arrest of a cdc15 temperature-sensitive mutant. Using periodicity and correlation algorithms, we identified 800 genes that meet an objective minimum criterion for cell cycle regulation. In separate experiments, designed to examine the effects of inducing either the G1 cyclin Cln3p or the B-type cyclin Clb2p, we found that the mRNA levels of more than half of these 800 genes respond to one or both of these cyclins. Furthermore, we analyzed our set of cell cycle-regulated genes for known and new promoter elements and show that several known elements (or variations thereof) contain information predictive of cell cycle regulation. A full description and complete data sets are available at http://cellcycle-www.stanford.edu
Figures


Comment in
-
It's the data!Mol Biol Cell. 2010 Jan 1;21(1):4-6. doi: 10.1091/mbc.e09-07-0575. Mol Biol Cell. 2010. PMID: 20048255 Free PMC article.
Similar articles
-
Removal of a single alpha-tubulin gene intron suppresses cell cycle arrest phenotypes of splicing factor mutations in Saccharomyces cerevisiae.Mol Cell Biol. 2002 Feb;22(3):801-15. doi: 10.1128/MCB.22.3.801-815.2002. Mol Cell Biol. 2002. PMID: 11784857 Free PMC article.
-
The forkhead protein Fkh2 is a component of the yeast cell cycle transcription factor SFF.EMBO J. 2000 Jul 17;19(14):3750-61. doi: 10.1093/emboj/19.14.3750. EMBO J. 2000. PMID: 10899128 Free PMC article.
-
Cell cycle-dependent transcription of CLN2 is conferred by multiple distinct cis-acting regulatory elements.Mol Cell Biol. 1994 Jul;14(7):4788-801. doi: 10.1128/mcb.14.7.4788-4801.1994. Mol Cell Biol. 1994. PMID: 8007978 Free PMC article.
-
Regulation of DNA replication during the yeast cell cycle.Cold Spring Harb Symp Quant Biol. 1991;56:279-84. doi: 10.1101/sqb.1991.056.01.034. Cold Spring Harb Symp Quant Biol. 1991. PMID: 1819492 Review. No abstract available.
-
New cell cycle-regulated genes in the yeast Saccharomyces cerevisiae.Recent Results Cancer Res. 1997;143:251-61. doi: 10.1007/978-3-642-60393-8_18. Recent Results Cancer Res. 1997. PMID: 8912425 Review. No abstract available.
Cited by
-
Computational discovery of regulatory elements in a continuous expression space.Genome Biol. 2012 Nov 27;13(11):R109. doi: 10.1186/gb-2012-13-11-r109. Genome Biol. 2012. PMID: 23186104 Free PMC article.
-
Phosphate Homeostasis - A Vital Metabolic Equilibrium Maintained Through the INPHORS Signaling Pathway.Front Microbiol. 2020 Jul 14;11:1367. doi: 10.3389/fmicb.2020.01367. eCollection 2020. Front Microbiol. 2020. PMID: 32765429 Free PMC article. Review.
-
Regulatory design governing progression of population growth phases in bacteria.PLoS One. 2012;7(2):e30654. doi: 10.1371/journal.pone.0030654. Epub 2012 Feb 21. PLoS One. 2012. PMID: 22363461 Free PMC article.
-
Swimming upstream: identifying proteomic signals that drive transcriptional changes using the interactome and multiple "-omics" datasets.Methods Cell Biol. 2012;110:57-80. doi: 10.1016/B978-0-12-388403-9.00003-5. Methods Cell Biol. 2012. PMID: 22482945 Free PMC article.
-
High-Throughput Transcriptomics Differentiates Toxic versus Non-Toxic Chemical Exposures Using a Rat Liver Model.Int J Mol Sci. 2023 Dec 13;24(24):17425. doi: 10.3390/ijms242417425. Int J Mol Sci. 2023. PMID: 38139254 Free PMC article.
References
-
- Amon A, Tyers M, Futcher B, Nasmyth K. Mechanisms that help the yeast cell cycle clock tick: G2 cyclins transcriptionally activate G2 cyclins and repress G1 cyclins. Cell. 1993;74:993–1007. - PubMed
-
- Andrews B, Measday V. The cyclin family of budding yeast: abundant use of a good idea. Trends Genet. 1998;14:66–72. - PubMed
-
- Andrews BJ, Herskowitz I. Identification of a DNA binding factor involved in cell-cycle control of the yeast HO gene. Cell. 1989;57:21–29. - PubMed
Publication types
MeSH terms
Substances
Grants and funding
LinkOut - more resources
Full Text Sources
Other Literature Sources
Molecular Biology Databases

