

Diverse host responses and outcomes following simian immunodeficiency virus SIVmac239 infection in sooty mangabeys and rhesus macaques
- PMID: 9811693
- PMCID: PMC110469
- DOI: 10.1128/JVI.72.12.9597-9611.1998
Diverse host responses and outcomes following simian immunodeficiency virus SIVmac239 infection in sooty mangabeys and rhesus macaques
Abstract
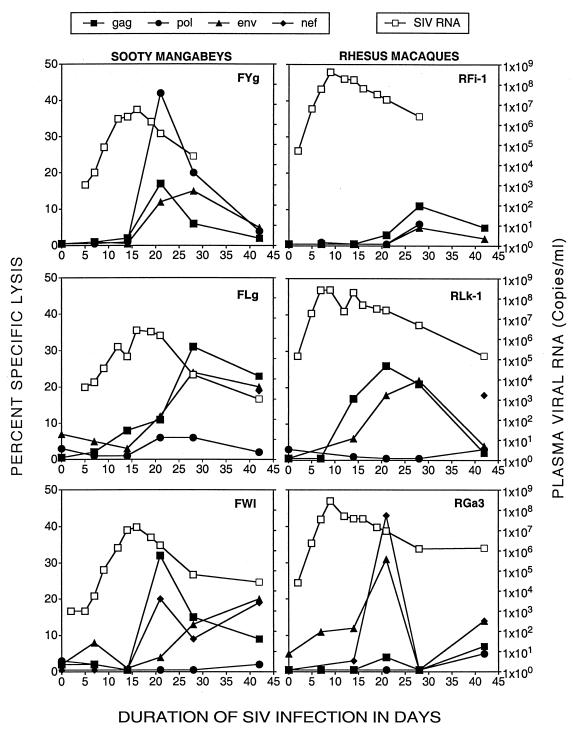
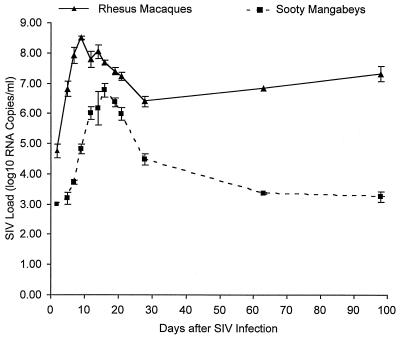
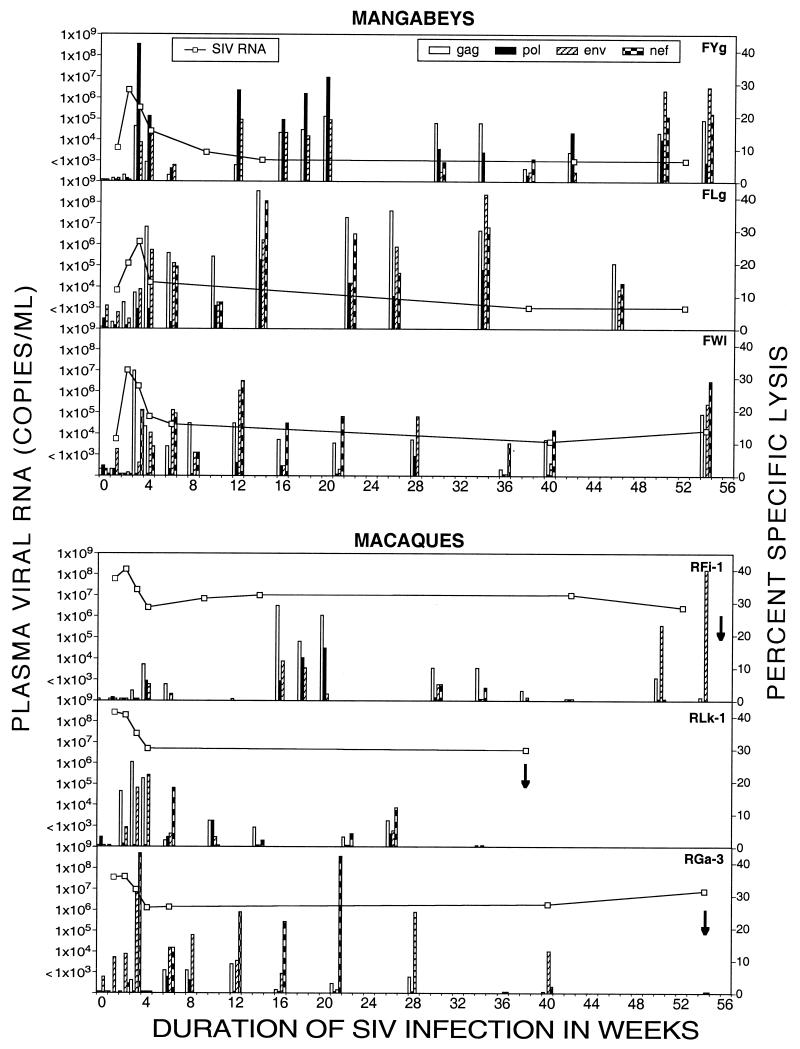
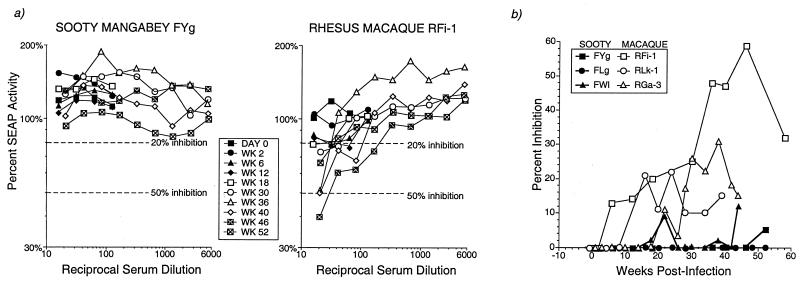
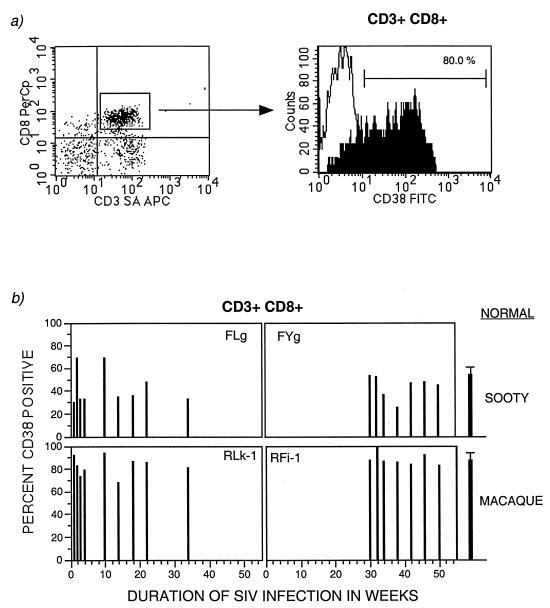
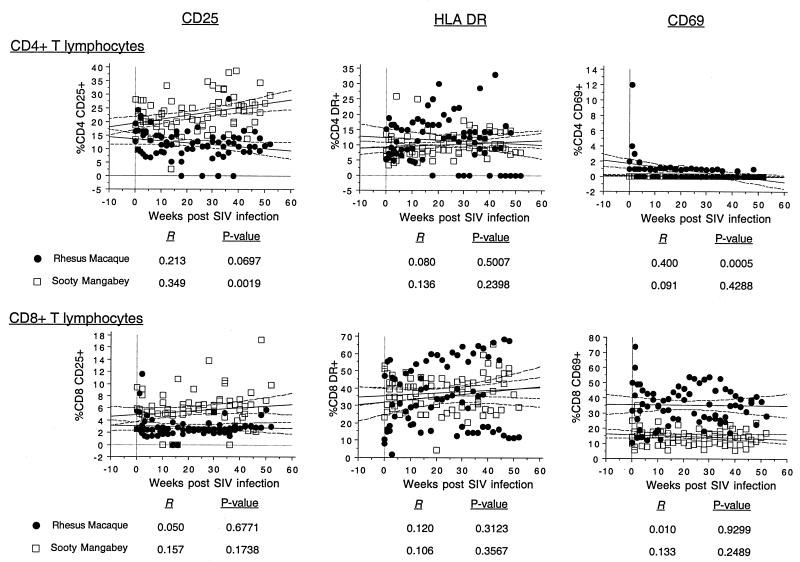
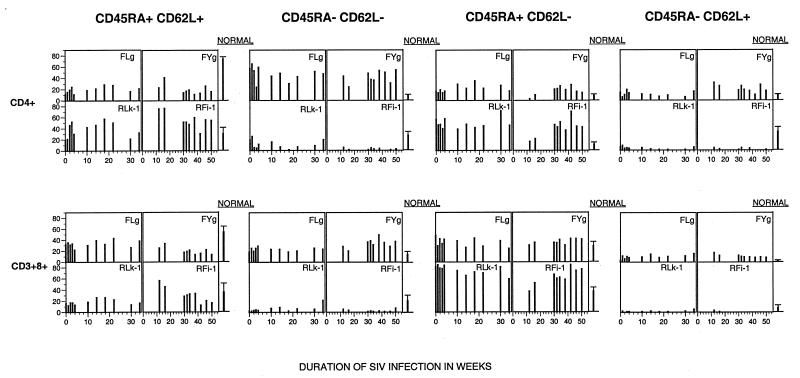
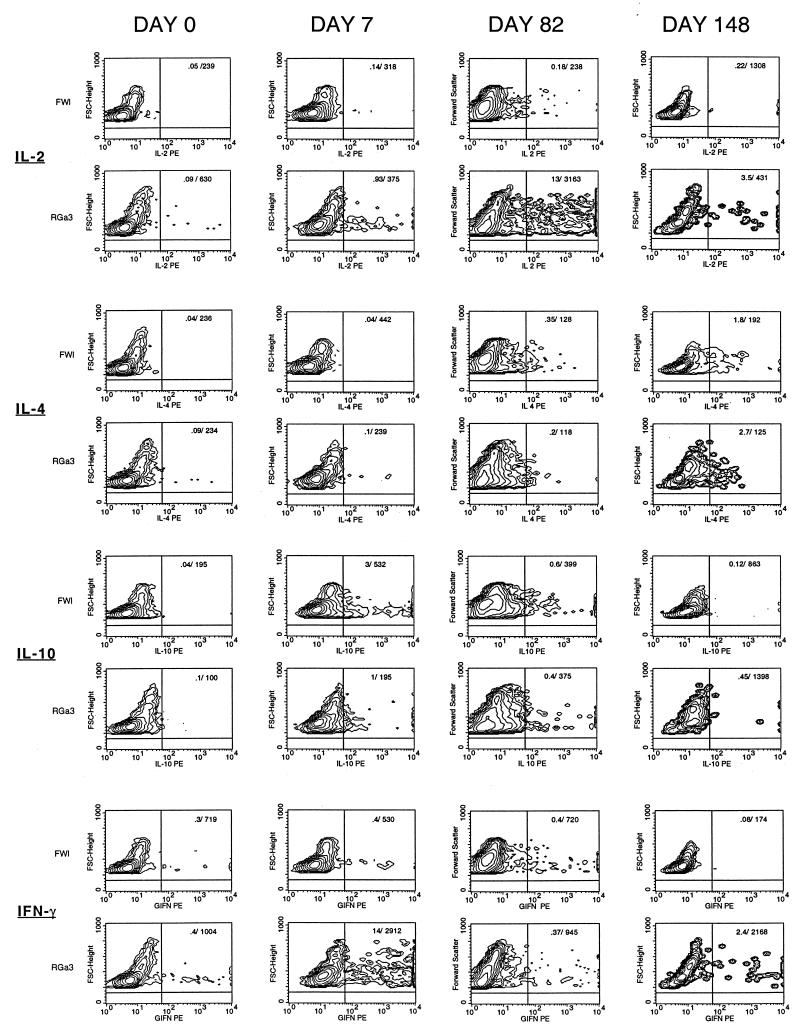
Sooty mangabeys naturally infected with simian immunodeficiency virus (SIV) do not develop immunodeficiency despite the presence of viral loads of 10(5) to 10(7) RNA copies/ml. To investigate the basis of apathogenic SIV infection in sooty mangabeys, three sooty mangabeys and three rhesus macaques were inoculated intravenously with SIVmac239 and evaluated longitudinally for 1 year. SIVmac239 infection of sooty mangabeys resulted in 2- to 4-log-lower viral loads than in macaques and did not reproduce the high viral loads observed in natural SIVsmm infection. During acute SIV infection, polyclonal cytotoxic T-lymphocyte (CTL) activity coincident with decline in peak plasma viremia was observed in both macaques and mangabeys; 8 to 20 weeks later, CTL activity declined in the macaques but was sustained and broadly directed in the mangabeys. Neutralizing antibodies to SIVmac239 were detected in the macaques but not the mangabeys. Differences in expression of CD38 on CD8(+) T lymphocytes or in the percentage of naive phenotype T cells expressing CD45RA and CD62L-selection did not correlate with development of AIDS in rhesus macaques. In macaques, the proportion of CD4(+) T lymphocytes expressing CD25 declined during SIV infection, while in mangabeys, CD25-expressing CD4(+) T lymphocytes increased. Longitudinal evaluation of cytokine secretion by flow cytometric analysis of unstimulated lymphocytes revealed elevation of interleukin-2 and gamma interferon in a macaque and only interleukin-10 in a concurrently infected mangabey during acute SIV infection. Differences in host responses following experimental SIVmac239 infection may be associated with the divergent outcome in sooty mangabeys and rhesus macaques.
Figures

Similar articles
-
Th-1-type cytotoxic CD8+ T-lymphocyte responses to simian immunodeficiency virus (SIV) are a consistent feature of natural SIV infection in sooty mangabeys.J Virol. 2006 Mar;80(6):2771-83. doi: 10.1128/JVI.80.6.2771-2783.2006. J Virol. 2006. PMID: 16501086 Free PMC article.
-
Differential CD4+ T-lymphocyte apoptosis and bystander T-cell activation in rhesus macaques and sooty mangabeys during acute simian immunodeficiency virus infection.J Virol. 2009 Jan;83(2):572-83. doi: 10.1128/JVI.01715-08. Epub 2008 Nov 5. J Virol. 2009. PMID: 18987149 Free PMC article.
-
Normal T-cell turnover in sooty mangabeys harboring active simian immunodeficiency virus infection.J Virol. 2000 Feb;74(3):1209-23. doi: 10.1128/jvi.74.3.1209-1223.2000. J Virol. 2000. PMID: 10627531 Free PMC article.
-
Naturally SIV-infected sooty mangabeys: are we closer to understanding why they do not develop AIDS?J Med Primatol. 2005 Oct;34(5-6):243-52. doi: 10.1111/j.1600-0684.2005.00122.x. J Med Primatol. 2005. PMID: 16128919 Review.
-
The paradox of simian immunodeficiency virus infection in sooty mangabeys: active viral replication without disease progression.Front Biosci. 2004 Jan 1;9:521-39. doi: 10.2741/1123. Front Biosci. 2004. PMID: 14766388 Review.
Cited by
-
Kinetics of T lymphocyte apoptosis and the cellular immune response in SIVmac239-infected rhesus macaques.J Med Primatol. 2008 Dec;37 Suppl 2(Suppl 2):33-45. doi: 10.1111/j.1600-0684.2008.00323.x. J Med Primatol. 2008. PMID: 19187429 Free PMC article.
-
Simian immunodeficiency virus SIVagm dynamics in African green monkeys.J Virol. 2008 Apr;82(7):3713-24. doi: 10.1128/JVI.02402-07. Epub 2008 Jan 23. J Virol. 2008. PMID: 18216122 Free PMC article.
-
Inefficient Nef-mediated downmodulation of CD3 and MHC-I correlates with loss of CD4+T cells in natural SIV infection.PLoS Pathog. 2008 Jul 18;4(7):e1000107. doi: 10.1371/journal.ppat.1000107. PLoS Pathog. 2008. PMID: 18636106 Free PMC article.
-
TRIM5alpha Modulates Immunodeficiency Virus Control in Rhesus Monkeys.PLoS Pathog. 2010 Jan 22;6(1):e1000738. doi: 10.1371/journal.ppat.1000738. PLoS Pathog. 2010. PMID: 20107597 Free PMC article.
-
Reservoir host immune responses to emerging zoonotic viruses.Cell. 2015 Jan 15;160(1-2):20-35. doi: 10.1016/j.cell.2014.12.003. Epub 2014 Dec 18. Cell. 2015. PMID: 25533784 Free PMC article. Review.
References
-
- Ahmed-Ansari A, Brodie A R, Fultz P N, Anderson D C, Sell K W, McClure H M. Flow microfluorometric analysis of peripheral blood mononuclear cells from nonhuman primates: correlation of phenotype with immune function. Am J Primatol. 1989;17:107–131. - PubMed
-
- Ahmed-Ansari A, Powell J D, Jensen P E, Yehuda-Cohen T, McClure H M, Anderson D, Fultz P N, Sell K W. Requirements for simian immunodeficiency virus antigen-specific in vitro proliferation of T cells from infected rhesus macaques and sooty mangabeys. AIDS. 1990;4:399–407. - PubMed
-
- Ansari A A, Mayne A, Hunt D, Sundstrom J B, Villinger F. TH1/TH2 subset analysis. I. Establishment of criteria for subset identification in PBMC samples from nonhuman primates. J Med Primatol. 1994;23:102–107. - PubMed
-
- Benveniste O, Vaslin B, Grand R L, Cheret A, Matheux F, Theodoro F, Cranage M P, Dormont D. Comparative interleukin-2/interferon-γ and IL-4/IL-10 responses during acute infection of macaques inoculated with attenuated nef-truncated or pathogenic SIVmac251 virus. Proc Natl Acad Sci USA. 1996;93:3658–3663. - PMC - PubMed
-
- Buchbinder, S., et al. Unpublished data.
Publication types
MeSH terms
Substances
Grants and funding
LinkOut - more resources
Full Text Sources
Research Materials
