. 1998 Sep 21;142(6):1583-93.
doi: 10.1083/jcb.142.6.1583.

Blocking cytochrome c activity within intact neurons inhibits apoptosis

Affiliations

Blocking cytochrome c activity within intact neurons inhibits apoptosis

S J Neame et al. J Cell Biol. .

Abstract

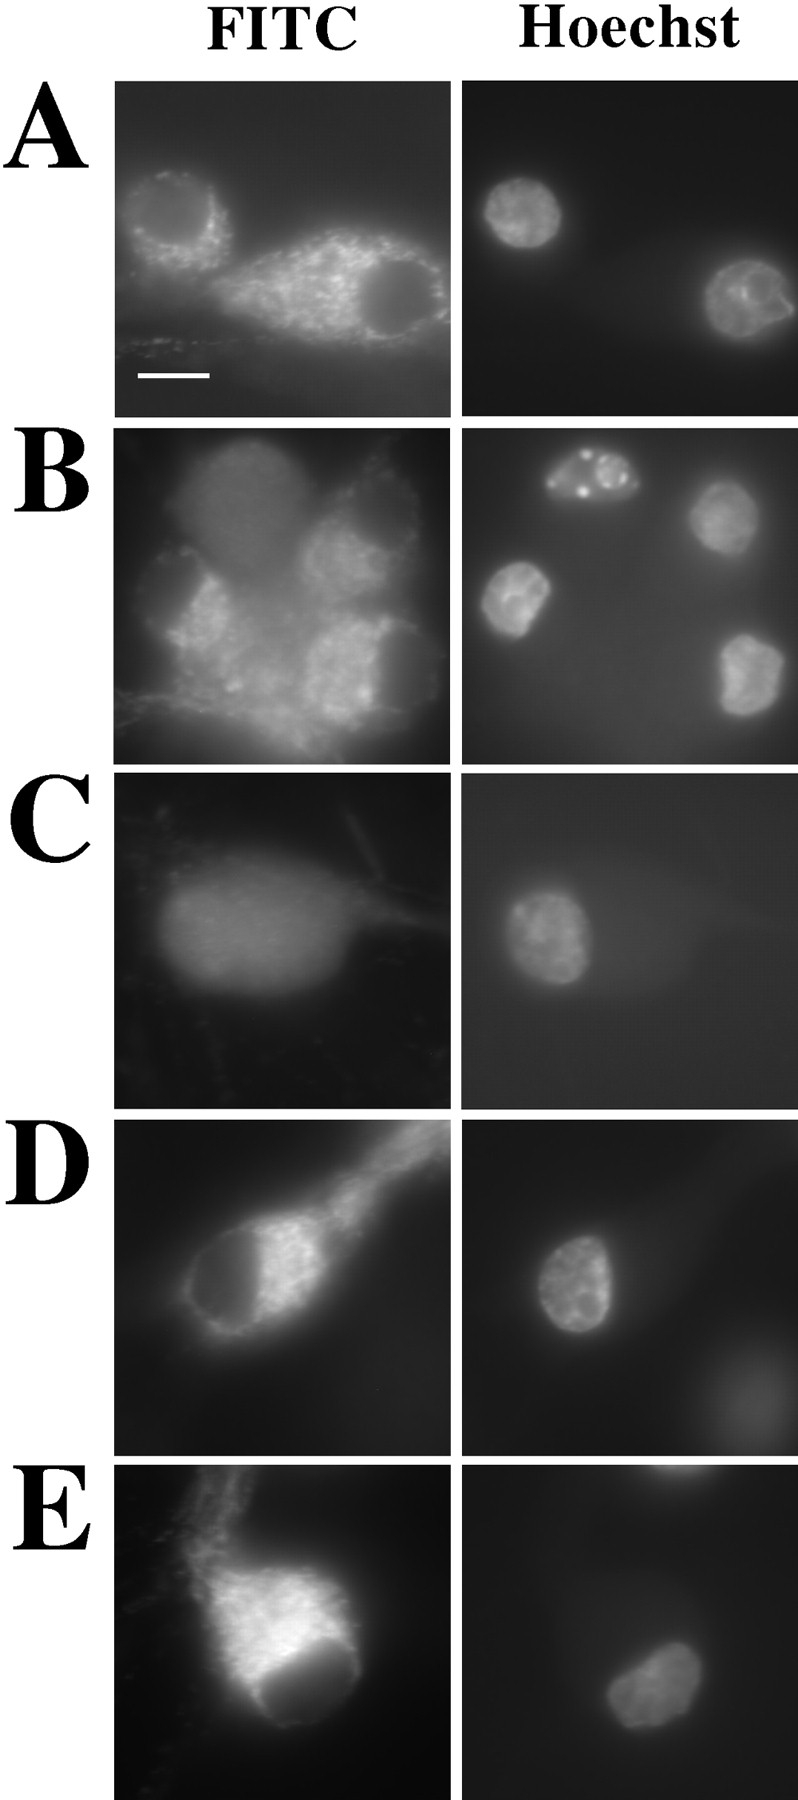
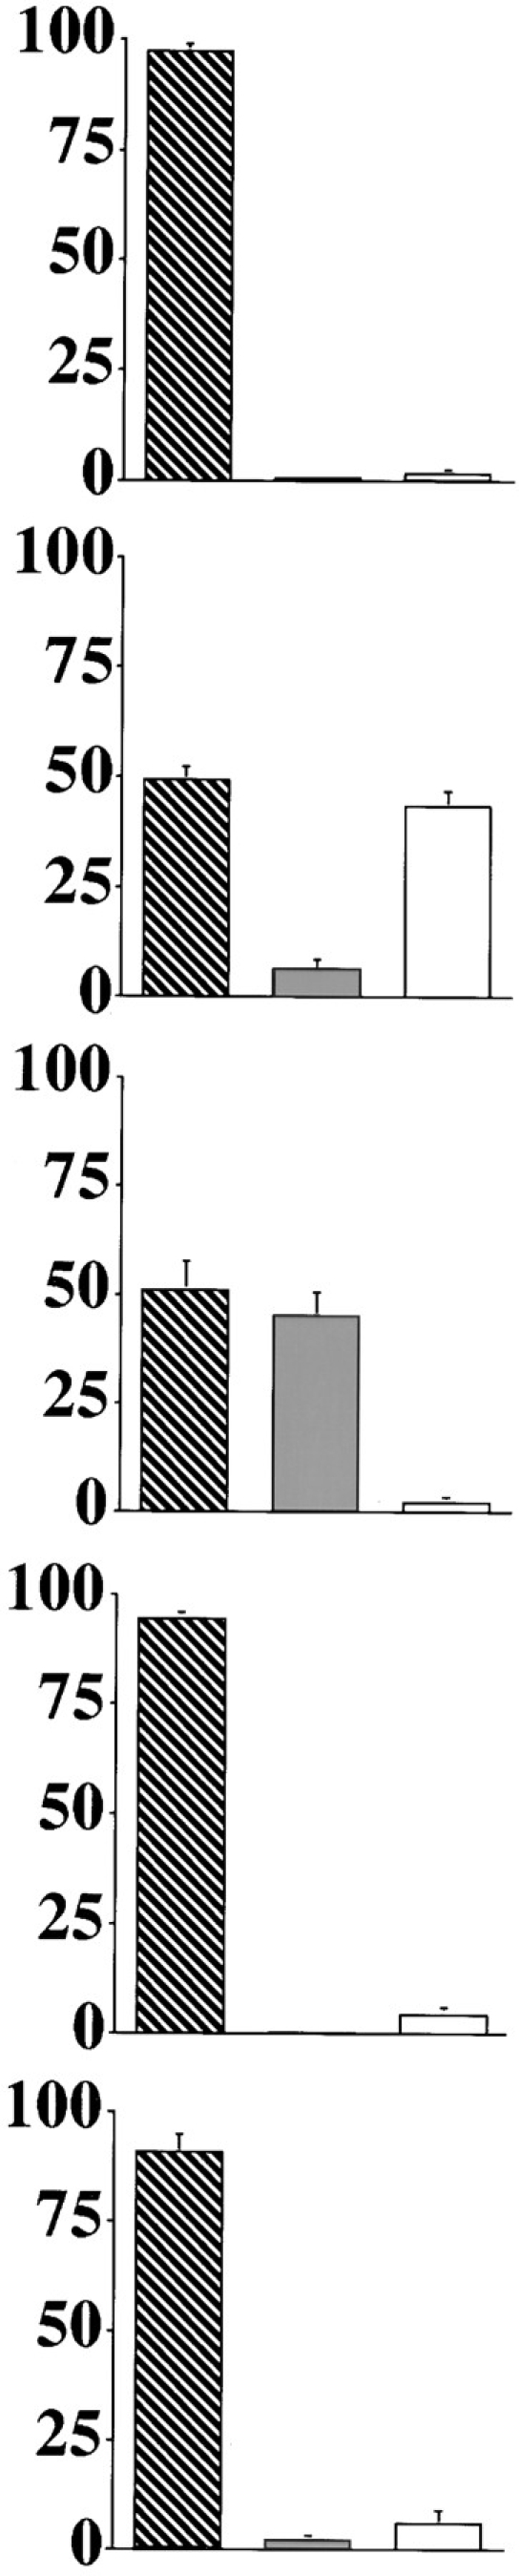
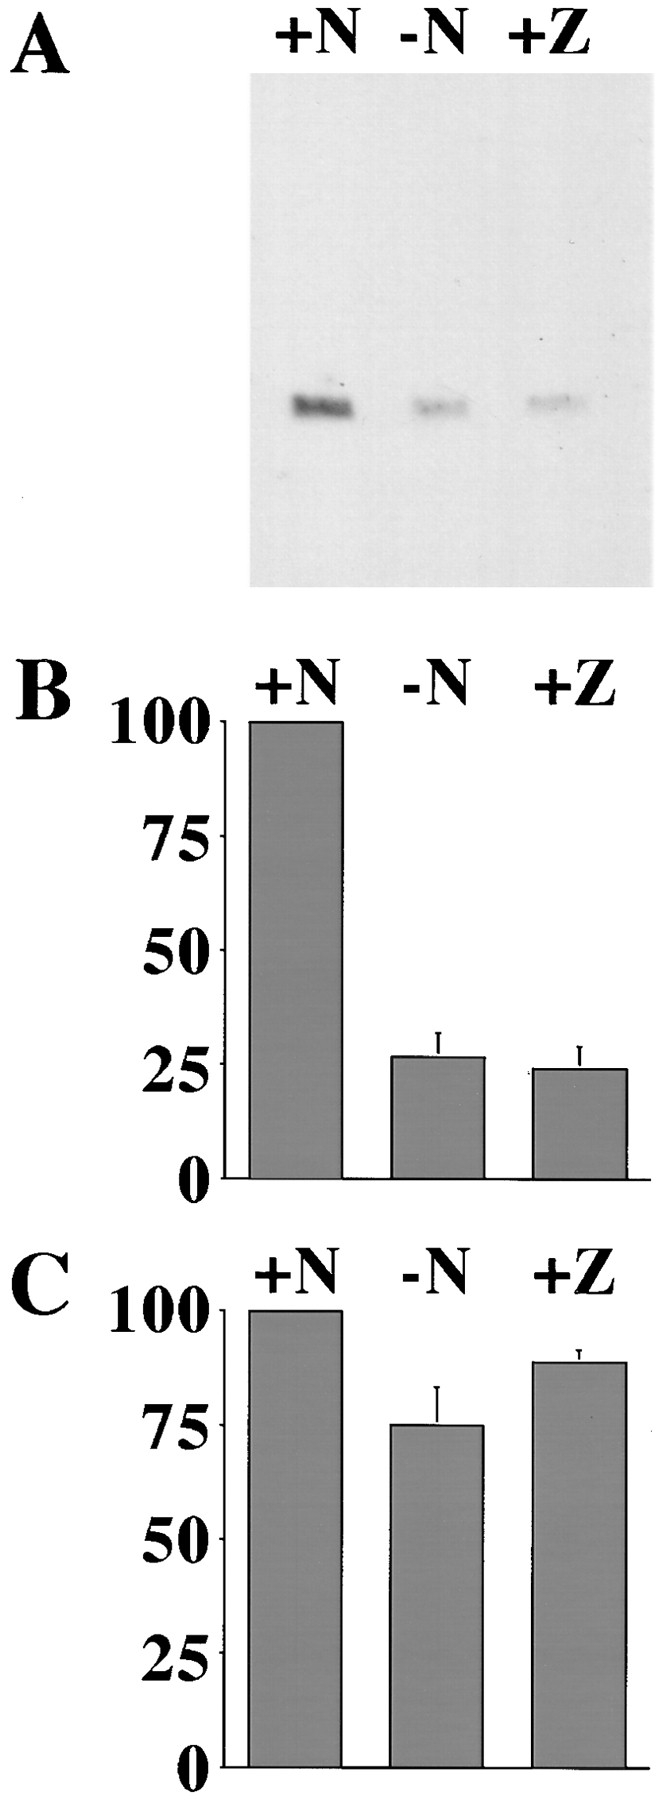
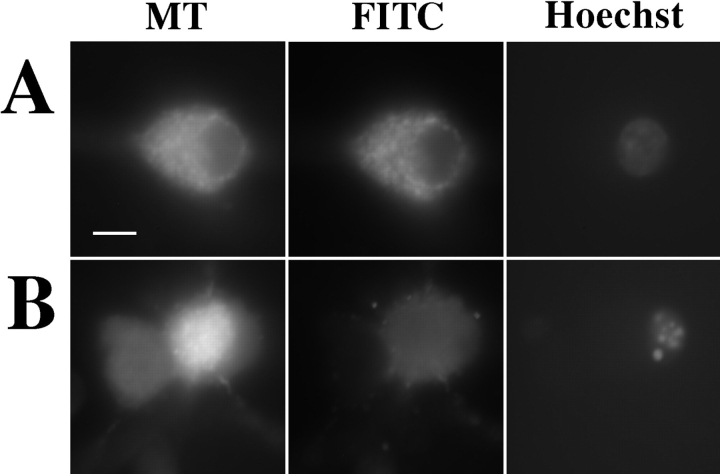
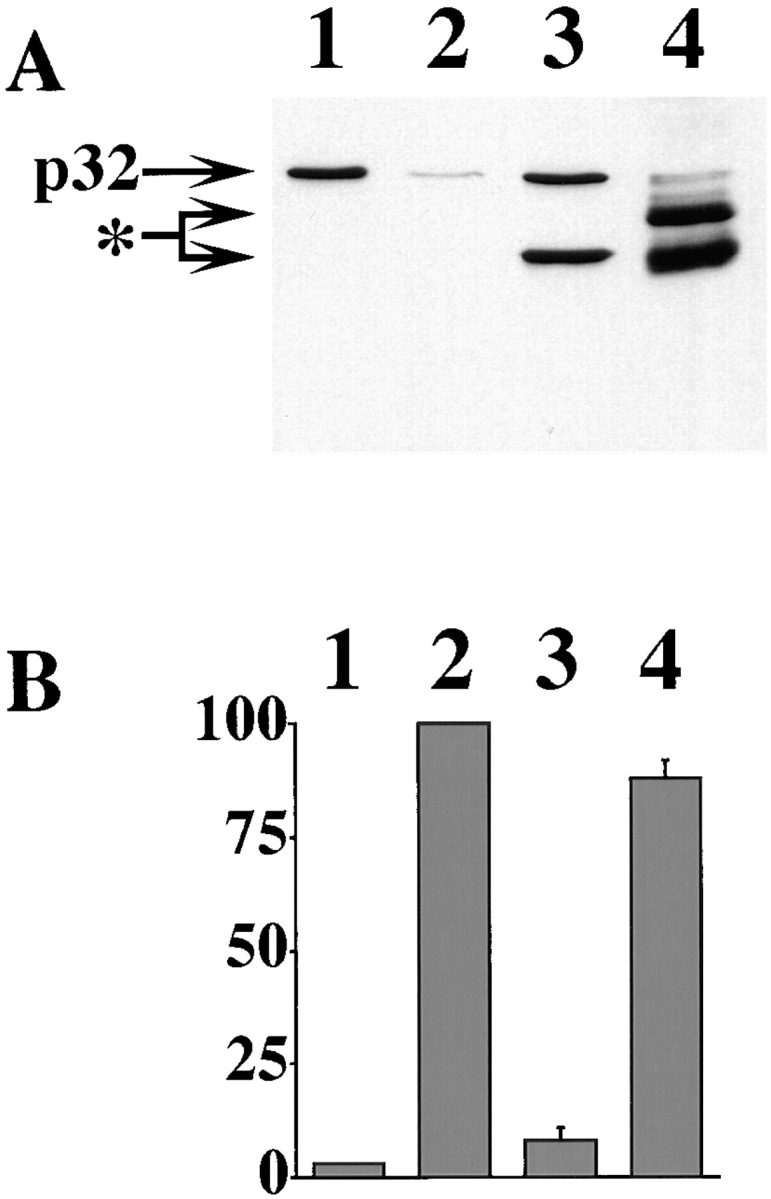
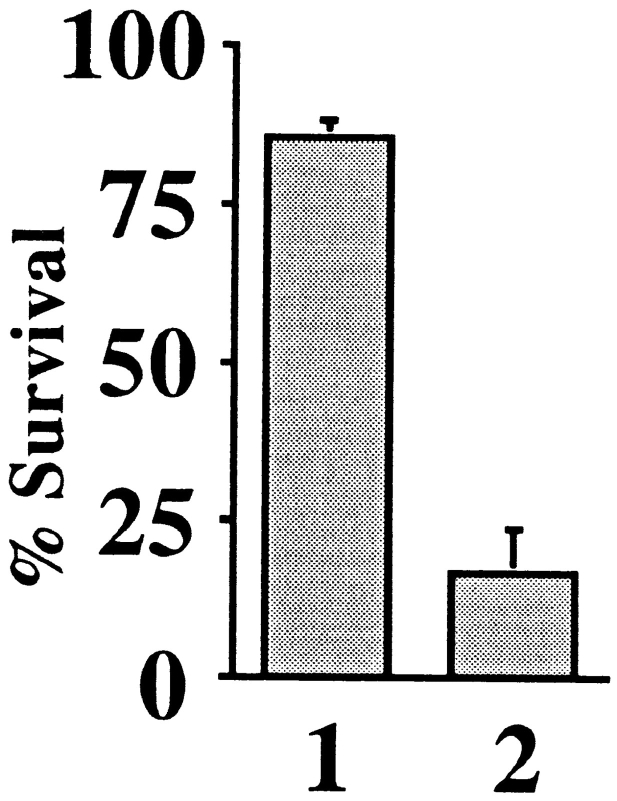
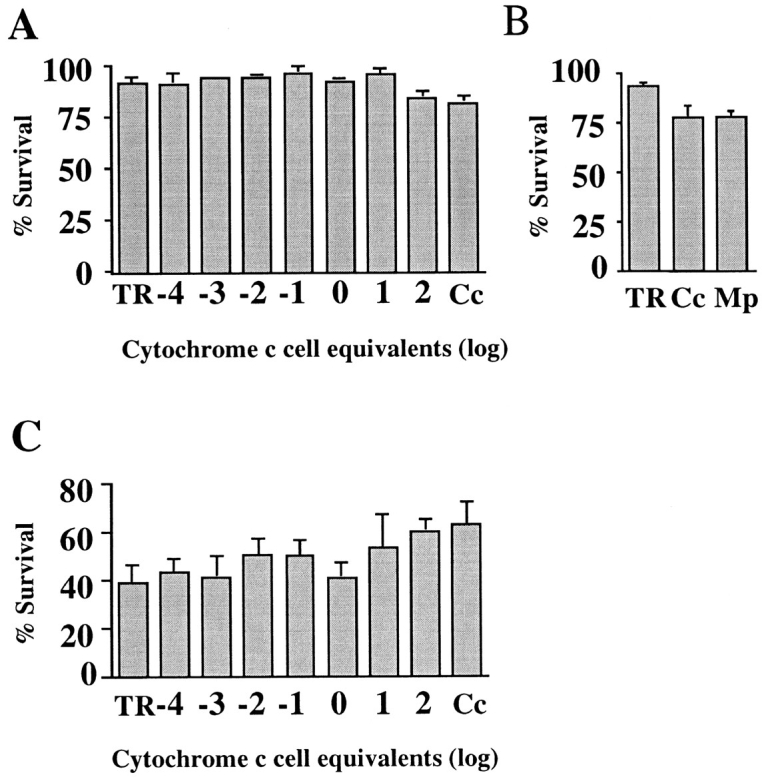
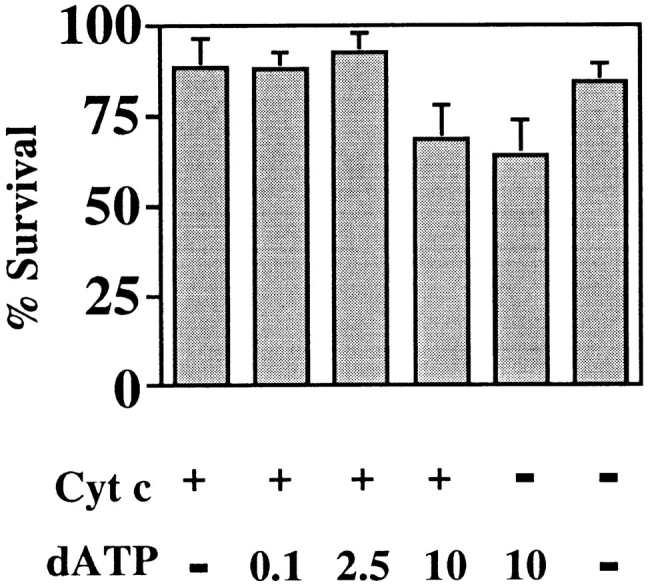
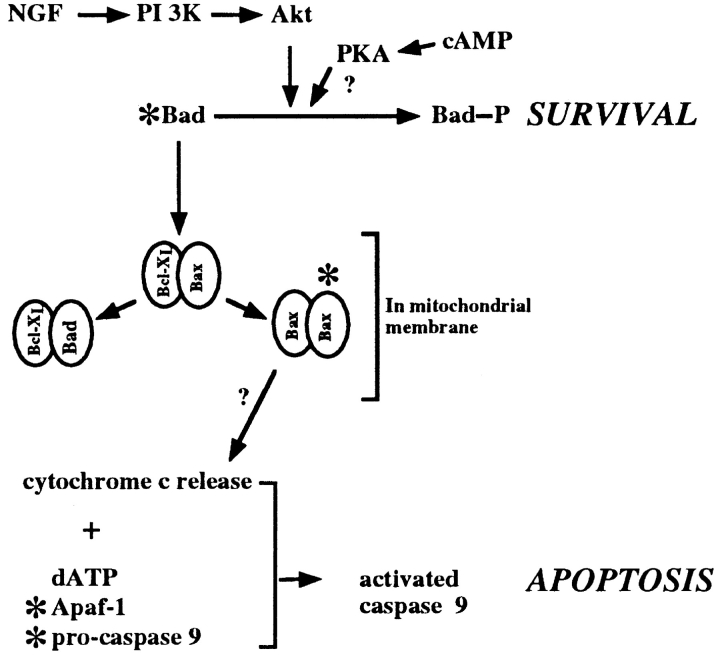
Cytochrome c has been shown to play a role in cell-free models of apoptosis. During NGF withdrawal-induced apoptosis of intact rat superior cervical ganglion (SCG) neurons, we observe the redistribution of cytochrome c from the mitochondria to the cytoplasm. This redistribution is not inhibited by the caspase inhibitor Z-Val-Ala-Asp-fluoromethylketone (ZVADfmk) but is blocked by either of the neuronal survival agents 8-(4-chlorophenylthio)adenosine 3':5'-cyclic monophosphate (CPT-cAMP) or cycloheximide. Moreover, microinjection of SCG neurons with antibody to cytochrome c blocks NGF withdrawal-induced apoptosis. However, microinjection of SCG neurons with cytochrome c does not alter the rate of apoptosis in either the presence or absence of NGF. These data suggest that cytochrome c is an intrinsic but not limiting component of the neuronal apoptotic pathway.


Figures

Figure 1
Figure 1
Cytochrome c redistributes from the mitochondria to the cytoplasm before nuclear condensation. SCG neurons were cultured on coverslips for 24 h in medium with NGF (A), or medium lacking NGF supplemented with carrier alone (B), 100 μM ZVADfmk (C), 1 μg/ml cycloheximide (D), or 100 μM CPT-cAMP (E). The cells were then fixed and stained for cytochrome c (FITC) and chromatin (Hoechst). Representative examples were imaged using a Xillix Microimager (Improvision-Image Processing and Vision Co. Ltd., Coventry, UK). Coverslips were mixed in a blind manner, and 10 random fields were counted per condition. Cells were evaluated as being either normal in cytochrome c distribution and nuclear morphology (hatched bars), diffuse in cytochrome c distribution and normal in nuclear morphology (shaded bars), or diffuse in cytochrome c and having pyknotic nuclei (open bars). The graphs show mean percentage of cells in each category and are the result of between four to seven experiments for each condition. The error bars represent SEM. Bar, 10 μm.
Figure 1
Figure 1
Cytochrome c redistributes from the mitochondria to the cytoplasm before nuclear condensation. SCG neurons were cultured on coverslips for 24 h in medium with NGF (A), or medium lacking NGF supplemented with carrier alone (B), 100 μM ZVADfmk (C), 1 μg/ml cycloheximide (D), or 100 μM CPT-cAMP (E). The cells were then fixed and stained for cytochrome c (FITC) and chromatin (Hoechst). Representative examples were imaged using a Xillix Microimager (Improvision-Image Processing and Vision Co. Ltd., Coventry, UK). Coverslips were mixed in a blind manner, and 10 random fields were counted per condition. Cells were evaluated as being either normal in cytochrome c distribution and nuclear morphology (hatched bars), diffuse in cytochrome c distribution and normal in nuclear morphology (shaded bars), or diffuse in cytochrome c and having pyknotic nuclei (open bars). The graphs show mean percentage of cells in each category and are the result of between four to seven experiments for each condition. The error bars represent SEM. Bar, 10 μm.
Figure 2
Figure 2
Cytochrome c degrades after release from the mitochondria. (A) SCG cultures were maintained in NGF (+N) or withdrawn from NGF in the absence (−N) or presence (+Z) of 100 μM ZVADfmk. Cells were lysed after 24 h, and protein from an equivalent number of cells was analyzed with an anti–cytochrome c antibody, 7H8.2C12. (B) Three representative blots were scanned on a densitometer, and the bars show the mean + SEM of the values obtained for cells maintained in NGF (+N) or withdrawn from NGF without (−N) or with (+Z) ZVADfmk. (C) These blots were later reanalyzed by immunoblot for ERK1/2, and the results are expressed as for the cytochrome c blots in B.
Figure 3
Figure 3
Redistribution of cytochrome c precedes the loss of mitochondrial inner membrane potential. SCG neurons were cultured on coverslips for 23 h in medium with NGF (A) or medium lacking NGF (B). Mitotracker was added to the medium at 450 nM and incubated for 30 min, and the medium was changed. The cells were incubated for a further 30 min and then fixed and stained as in Fig. 1. Representative cells are shown displaying Mitotracker (MT), cytochrome c (FITC), and chromatin (Hoechst) localization. Bar, 10 μm.
Figure 4
Figure 4
Anti–cytochrome c mAb 2G8.B6 inhibits the activation of caspase 3 in a cell-free assay. 50 μg Jurkat cytosol was incubated for 1 h without cytochrome c and dATP (lane 1) or with cytochrome c and dATP and with no additional components (lane 2), with 2 μg 2G8.B6 anti–cytochrome c mAb (lane 3), or with 2 μg mouse Ig (lane 4). The reaction mix was split into two and analyzed by (A) PAGE and immunoblot for the proteolytic processing of caspase 3. p32 indicates the pro-caspase 3 band and the asterisk indicates the added antibody bands. (B) DEVD-AMC cleavage, for generation of active caspase. Results are expressed as the percentage fluorescence generated over an additional 1-h incubation and are the average of three to six experiments. The error bars represent SEM.
Figure 5
Figure 5
Microinjection of anti–cytochrome c mAb 2G8.B6 inhibits SCG apoptosis. SCG neurons were microinjected with either 20 mg/ml 2G8.B6 mAb (lane 1) or an equivalent concentration of mouse Ig (lane 2). After 2–4 h, the injected cells were counted, and the cultures were withdrawn from NGF. At 48 h, the number of surviving injected cells were counted and expressed as a percentage of the cells initially surviving injection. 150–200 cells were injected per coverslip, and the results shown are the average of five experiments. The error bars represent SEM.
Figure 6
Figure 6
Microinjection of cytochrome c does not induce or accelerate apoptosis in SCG neurons. SCG neurons were microinjected with cytochrome c and counted 2–4 h later. (A) Cells were maintained in NGF for 48 h before counting the surviving cells. The amount of cytochrome c injected is shown as log10 multiples of 1 cell equivalent (70 μg/ml in needle), except for lane TR, which contained no cytochrome c, and lane Cc, in which 17.5 mg/ml of cytochrome c was used. (B) Cells were maintained in NGF for 72 h before counting surviving cells. The microinjection mix in lane TR contained no cytochrome c, 1.45 mM cytochrome c (17.5 mg/ml) in lane Cc, and 1.45 mM microperoxidase in lane Mp. (C) Cells were withdrawn from NGF for 48 h before counting the surviving cells. The amount of cytochrome c injected is shown as log10 multiples of 1 cell equivalent (70 μg/ml in needle), except for lane TR, which contained no cytochrome c, and lane Cc, in which 17.5 mg/ml of cytochrome c was used. The results are expressed as a percentage of the cells initially surviving injection. 150–200 cells were injected per coverslip, and the results shown are the average of three to four experiments. The error bars represent SEM.
Figure 7
Figure 7
Coinjection of dATP does not enable cytochrome c to initiate apoptosis in SCG neurons. SCG neurons were microinjected with cytochrome c and dATP, counted 2–4 h later, and maintained in NGF for a further 72 h. The microinjection mix in the first four bars contained 0.7 mg/ml cytochrome c. dATP was added in the second bar at 100 μM, in the third bar at 2.5 mM, and in the fourth bar at 10 mM. The fifth bar contained 10 mM dATP alone, and the sixth bar contained no cytochrome c or dATP. The results are expressed as a percentage of the cells initially surviving injection. 150–200 cells were injected per coverslip, and the results shown are the average of three experiments. The error bars represent SEM.
Figure 8
Figure 8
A model for the mode of action of NGF, cAMP, and cycloheximide in neuronal cell death. In this model, NGF is shown to stimulate phosphatidylinositol 3-kinase, hence Akt kinase activity. Akt kinase can phosphorylate Bad, resulting in its sequestration in the cytosol and survival. However, in the absence of NGF, unphosphorylated Bad disrupts Bax:BclxL dimers in the mitochondrial membrane with the subsequent freeing of Bax to form Bax homodimers. These might be involved in the release of cytochrome c from the mitochondria. Cytochrome c forms a complex with Apaf-1, dATP, and pro-caspase 9, activating caspase 9. cAMP may act to phosphorylate Bad, and the possible sites of cycloheximide intervention are indicated by asterisks.

Similar articles

Cited by

References

    1. Antonsson B, Conti F, Ciavatta A, Montessuit S, Lewis S, Martinou I, Bernasconi L, Bernard A, Mermod J-J, Mazzei G, et al. Inhibition of Bax channel-forming activity by Bcl-2. Science. 1997;277:370–372. - PubMed
    1. Bortner CD, Oldenburg NBE, Cidlowski JA. The role of DNA fragmentation in apoptosis. Trends Cell Biol. 1995;5:21–26. - PubMed
    1. Bossy-Wetzel E, Newmeyer DD, Green DR. Mitochondrial cytochrome c release in apoptosis occurs upstream of DEVD-specific caspase activation and independently of mitochondrial transmembrane depolarization. EMBO (Eur Mol Biol Organ) J. 1998;17:37–49. - PMC - PubMed
    1. Bredesen DE. Neural apoptosis. Ann Neurol. 1995;38:839–851. - PubMed
    1. Brischwein K, Engelcke M, Riedinger HJ, Probst H. Role of ribonucleotide reductase and deoxynucleotide pools in the oxygen-dependent control of DNA replication in Ehrlich ascites cells. Eur J Biochem. 1997;244:286–293. - PubMed

MeSH terms