. 1998 Sep 21;142(6):1447-59.
doi: 10.1083/jcb.142.6.1447.

The muscle regulatory factors MyoD and myf-5 undergo distinct cell cycle-specific expression in muscle cells

Affiliations

The muscle regulatory factors MyoD and myf-5 undergo distinct cell cycle-specific expression in muscle cells

M Kitzmann et al. J Cell Biol. .

Abstract

The muscle regulators MyoD and Myf-5 control cell cycle withdrawal and induction of differentiation in skeletal muscle cells. By immunofluorescence analysis, we show that MyoD and Myf-5 expression patterns become mutually exclusive when C2 cells are induced to differentiate with Myf-5 staining present in cells which fail to differentiate. Isolation of these undifferentiated cells reveals that upon serum stimulation they reenter the cell cycle, express MyoD and downregulate Myf-5. Similar regulations of MyoD and Myf-5 were observed using cultured primary myoblasts derived from satellite cells. To further analyze these regulations of MyoD and Myf-5 expression, we synchronized proliferating myoblasts. Analysis of MyoD and Myf-5 expression during cell cycle progression revealed distinct and contrasting profiles of expression. MyoD is absent in G0, peaks in mid-G1, falls to its minimum level at G1/S and reaugments from S to M. In contrast, Myf-5 protein is high in G0, decreases during G1 and reappears at the end of G1 to remain stable until mitosis. These data demonstrate that the two myogenic factors MyoD and Myf-5 undergo specific and distinct cell cycle-dependent regulation, thus establishing a correlation between the cell cycle-specific ratios of MyoD and Myf-5 and the capacity of cells to differentiate: (a) in G1, when cells express high levels of MyoD and enter differentiation; (b) in G0, when cells express high levels of Myf-5 and fail to differentiate.


Figures

Figure 4
Figure 4
Methionine deprivation efficiently arrests mouse C2 myoblasts in a quiescent and nondifferentiated state. (A) 2 × 10⁴ C2 cells were plated on 35-mm dishes, grown in proliferation medium for 24 h and then were further grown for 36 h either in Ham F12 medium supplemented 1% serum (a–c) or in methionine-depleted medium plus 1% serum (d–f). At the end of this incubation time, cells were further incubated for 15 min with 0.1 mM BrdU (a and b) and then processed for immunofluorescence analysis using antibodies directed against BrdU to probe for DNA synthesis (a and d) or myogenin to probe for differentiation (c and f). Total nuclei corresponding to the cells described in a and d were revealed after DNA staining with Hoechst (b and e). (B) C2 cells cultured for 36 h in methionine-depleted medium + 1% FCS were then incubated for 15 h in either differentiation medium (g and h) or proliferation medium (i and j; see Materials and Methods) for 15 h in presence (g and i) or absence (h and j) of 0.1 mM BrdU. Cells were then fixed and processed for immunofluorescence analysis using antibodies against BrdU (g and i) or myogenin (h and j). Bar, 10 μM.
Figure 4
Figure 4
Methionine deprivation efficiently arrests mouse C2 myoblasts in a quiescent and nondifferentiated state. (A) 2 × 10⁴ C2 cells were plated on 35-mm dishes, grown in proliferation medium for 24 h and then were further grown for 36 h either in Ham F12 medium supplemented 1% serum (a–c) or in methionine-depleted medium plus 1% serum (d–f). At the end of this incubation time, cells were further incubated for 15 min with 0.1 mM BrdU (a and b) and then processed for immunofluorescence analysis using antibodies directed against BrdU to probe for DNA synthesis (a and d) or myogenin to probe for differentiation (c and f). Total nuclei corresponding to the cells described in a and d were revealed after DNA staining with Hoechst (b and e). (B) C2 cells cultured for 36 h in methionine-depleted medium + 1% FCS were then incubated for 15 h in either differentiation medium (g and h) or proliferation medium (i and j; see Materials and Methods) for 15 h in presence (g and i) or absence (h and j) of 0.1 mM BrdU. Cells were then fixed and processed for immunofluorescence analysis using antibodies against BrdU (g and i) or myogenin (h and j). Bar, 10 μM.
Figure 3
Figure 3
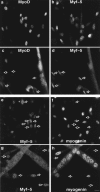
Coimmunofluorescence analysis of MyoD, Myf-5, and myogenin reveal two populations of myoblasts in mouse primary cells with different commitment to differentiation. Coimmunofluorescence analysis of MyoD and Myf-5 and in exponentially growing mouse primary myoblasts (a and b) and in differentiated cells after 3 d in DME 5% FCS (c and d). Coimmunofluorescence analysis of Myf-5 and myogenin in satellite cells differentiated for 12 h (e and f) and for 3 d (g and h). Arrowed in c and d are mononucleated cells expressing Myf-5 with no MyoD and arrowed in e–h are cells expressing Myf-5 which are devoid of myogenin. Bar, 10 μM.
Figure 2
Figure 2
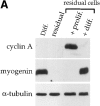
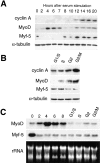
Differentiation-deficient myoblasts isolated from differentiated cells can reinduce MyoD and reactivate the differentiation program. C2 cells were allowed to differentiate for three days in differentiation medium. Mononucleated myoblasts were isolated after removing the population of myotubes after a short trypsinization of the culture. (A) Western blot analysis was carried out for cyclin A, myogenin, and α-tubulin on protein extracts from the total differentiated cells before trypsinization (Diff.), residual adherent cells after trypsinization (residual), residual cells refed for 24 h with serum-containing medium (residual cells + prolif.) or residual cells first refed with proliferation medium for 24 h and then switched to differentiation medium for 2 d (residual cells + diff.). (B) Adherent residual cells were allowed to reenter the cell cycle by adding serum-containing medium to the culture. Protein extracts at the indicated times after refeeding with proliferation medium were analyzed by Western blotting for MyoD, Myf-5, and α-tubulin expression.
Figure 2
Figure 2
Differentiation-deficient myoblasts isolated from differentiated cells can reinduce MyoD and reactivate the differentiation program. C2 cells were allowed to differentiate for three days in differentiation medium. Mononucleated myoblasts were isolated after removing the population of myotubes after a short trypsinization of the culture. (A) Western blot analysis was carried out for cyclin A, myogenin, and α-tubulin on protein extracts from the total differentiated cells before trypsinization (Diff.), residual adherent cells after trypsinization (residual), residual cells refed for 24 h with serum-containing medium (residual cells + prolif.) or residual cells first refed with proliferation medium for 24 h and then switched to differentiation medium for 2 d (residual cells + diff.). (B) Adherent residual cells were allowed to reenter the cell cycle by adding serum-containing medium to the culture. Protein extracts at the indicated times after refeeding with proliferation medium were analyzed by Western blotting for MyoD, Myf-5, and α-tubulin expression.
Figure 8
Figure 8
Cell cycle variation of Myf-5 occurs independently of MyoD and Myf-5 expression declines only in mitosis in cycling cells. (A) To examine if the cyclic pattern of Myf-5 expression was associated with the changes in MyoD expression, we examined Myf-5 expression pattern in inducible C2 cells, a variant of C2 cells which express Myf-5 but not MyoD (see Materials and Methods). Cells were synchronized by methionine deprivation and HU block as for the C2 parental cells (see Fig. 5). Protein extracts were analyzed by Western blot analysis for cyclin A, Myf-5 and α-tubulin expression at indicated times, in G1 cells (G0 to 8 h after refeeding) and in cells resynchronized in S-phase with HU (G1/ S to G2/M). (B) To examine Myf-5 expression in the course of a nonarrested cell cycle, inducible C2 cells were blocked with nocodazole and Myf-5 expression pattern was analyzed after release from nocodazole (at the indicated times) in comparison with nocodazole blocked cells (0) and asynchronous cells (cont). Protein extracts were analyzed by Western blot analysis for Myf-5 and α-tubulin expression.
Figure 8
Figure 8
Cell cycle variation of Myf-5 occurs independently of MyoD and Myf-5 expression declines only in mitosis in cycling cells. (A) To examine if the cyclic pattern of Myf-5 expression was associated with the changes in MyoD expression, we examined Myf-5 expression pattern in inducible C2 cells, a variant of C2 cells which express Myf-5 but not MyoD (see Materials and Methods). Cells were synchronized by methionine deprivation and HU block as for the C2 parental cells (see Fig. 5). Protein extracts were analyzed by Western blot analysis for cyclin A, Myf-5 and α-tubulin expression at indicated times, in G1 cells (G0 to 8 h after refeeding) and in cells resynchronized in S-phase with HU (G1/ S to G2/M). (B) To examine Myf-5 expression in the course of a nonarrested cell cycle, inducible C2 cells were blocked with nocodazole and Myf-5 expression pattern was analyzed after release from nocodazole (at the indicated times) in comparison with nocodazole blocked cells (0) and asynchronous cells (cont). Protein extracts were analyzed by Western blot analysis for Myf-5 and α-tubulin expression.
Figure 5
Figure 5
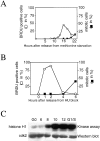
C2 myoblasts can be efficiently and accurately synchronized in a precise phase of their cell division cycle. Asynchronous C2 cells were arrested in quiescence by incubation in methionine depleted medium containing 1% serum for 36 h. Reentry into the cell cycle was allowed by refeeding them with proliferation medium. At different times after refeeding, cells were pulse-labeled for 15 min with BrdU before fixation and analysis for BrdU incorporation by immunofluorescence. (A) Plotted values represent the percentage of cells positive for BrdU incorporation (empty circles) and the percentage of mitotic cells (filled squares) over the total population of cells at given times after restimulation. (B) Cells, made quiescent by methionine deprivation, were induced to proliferate with serum containing medium and HU was added from 1 to 15 h after refeeding, allowing cells to progress through G1. Cells were subsequently released from HU block by washing off the HU and addition of serum containing medium, pulse-labeled for 15 min with BrdU and processed for immunofluorescence analysis at the indicated times. The percentage of cells in S phase was determined by counting BrdU positive cells over the total number of cells (empty circles). The percentage of mitotic cells is also plotted (filled squares). Percentages in A and B were determined after counting >300 cells for each point. (C) cdk2 protein was immunoprecipitated from quiescent myoblasts at different times after release from methionine deprivation and from G1/S blocked myoblasts which were released 15 h after the addition of HU as in B (see Material and Methods). cdk2 kinase activity was evaluated against histone H1. Shown is an autoradiograph of the radioactivity incorporated into histone H1 and a Western blot analysis of the same membrane probed for anti-cdk2. Times above are in hours after refeeding. Synchronized cells with HU block are marked G1/S.
Figure 9
Figure 9
Schematic representation of the cell cycle related changes in MyoD and Myf-5, with the potential links to the capacity of muscle cells to differentiate. Entry into differentiation occurs in G1 phase of muscle division cycle as determined by Nadal-Ginard (1978). The values plotted of MyoD and Myf-5 from G1/S boundary to G2/M were drawn from double block synchronization (first block in G0 after methionine deprivation, second block in G1/S after HU treatment), whereas the values plotted for G0 and G1 were drawn from single G0 block. Arbitrary units correspond to the relative protein levels of MyoD or Myf-5 corrected for loading variations using α-tubulin immunoblot as a control. Error bars represent maximal variations for each value.
Figure 1
Figure 1
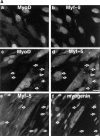
Analysis of MyoD, Myf-5 and myogenin reveal two populations of myoblasts with different commitment to differentiation. (A) Coimmunofluorescence analysis of MyoD and Myf-5 in exponentially growing C2 cells (a and b) and in differentiated cells after 3 d in differentiation medium (c and d). Differentiated cells were also analyzed by costaining for Myf-5 with myogenin (e and f). Arrowed in c and d are mononucleated cells expressing Myf-5 with no MyoD and arrowed in e and f are cells expressing Myf-5 that are devoid of myogenin. (B) Limited trypsinization of differentiated cells gave rise to two populations of cells: residual adherent cells and detached myotubes (top). Western blot analysis of these two populations was carried out for myogenin, MyoD, Myf-5, and α-tubulin (bottom). Bar, 10 μM.
Figure 1
Figure 1
Analysis of MyoD, Myf-5 and myogenin reveal two populations of myoblasts with different commitment to differentiation. (A) Coimmunofluorescence analysis of MyoD and Myf-5 in exponentially growing C2 cells (a and b) and in differentiated cells after 3 d in differentiation medium (c and d). Differentiated cells were also analyzed by costaining for Myf-5 with myogenin (e and f). Arrowed in c and d are mononucleated cells expressing Myf-5 with no MyoD and arrowed in e and f are cells expressing Myf-5 that are devoid of myogenin. (B) Limited trypsinization of differentiated cells gave rise to two populations of cells: residual adherent cells and detached myotubes (top). Western blot analysis of these two populations was carried out for myogenin, MyoD, Myf-5, and α-tubulin (bottom). Bar, 10 μM.
Figure 6
Figure 6
MyoD and Myf-5 are subject to different cell cycle– dependent regulation. C2 myoblasts cultured with methionine-depleted medium containing 1% serum were refed with proliferation medium. Proteins (A and B) and mRNA (C) were extracted at different times after refeeding. (A) Western blot analysis of proteins extracted from G0 to 20 h. Similar membranes were blotted for cyclin A, Myf-5, MyoD, and α-tubulin (an internal loading control). (B) To analyze the expression of proteins in the second part of the cell cycle, i.e., from G1/S to G2/M, cells were resynchronized after methionine starvation by incubation in HU for 15 h in proliferation medium. Shown is the expression of cyclin A, Myf-5, MyoD, and α-tubulin in resynchronized cells: S, G2, and G2/M represent cells fixed 2, 4, and 6 h, respectively, after release from HU. (C) mRNA expression was analyzed in G1 cells (G0 to 8 h after refeeding) and in cells resynchronized in S-phase with HU (G1/S to G2/M). Expression of Myf-5 and MyoD mRNA is shown with homogeneity in RNA loading demonstrated by revealing ribosomal RNA after ethidium bromide staining.
Figure 7
Figure 7
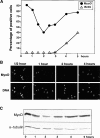
Analysis of MyoD expression after mitotic shake off reveals rapid changes in its expression. The expression profile for MyoD was also assessed in the course of normal cell cycle. Mitotic cells, detached by repeated shakes, were allowed to attach and grown for different times prior (a) to a 15-min pulse labeling with BrdU to assess S-phase (b) immunofluorescence analysis to assess the proportion of MyoD positive cells, (c) Western blotting to assess the amount of MyoD. (A) Comparative percentage of MyoD-expressing cells and of cells positive for BrdU incorporation after immunofluorescence analysis. (B) Immunofluorescence analysis photomicrographs of replated myoblasts stained for MyoD at different times after mitotic shake off. Shown are cells stained for MyoD (top) and the same cells stained for DNA with Hoechst (bottom). (C) Protein extracts, from cells replated after mitotic shake off and grown for 1–5 h, were analyzed for MyoD expression (top) and α-tubulin as an internal control (bottom). Bar, 10 μM.

Similar articles

Cited by

References

    1. Albagli-Curiel O, Carnac G, Vandromme M, Vincent S, Crepieux P, Bonnieu A. Serum-induced inhibition of myogenesis is differentially relieved by retinoic acid and triiodothyronine in C2 murine muscle cells. Differentiation. 1993;52:201–210. - PubMed
    1. Alterio J, Courtois Y, Robelin J, Bechet D, Martelly I. Acidic and basic fibroblast growth factor mRNAs are expressed by skeletal muscle satellite cells. Biochem Biophys Res Commun. 1990;166:1205–1212. - PubMed
    1. Andrés V, Walsh K. Myogenin expression, cell cycle withdrawal, and phenotypic differentiation are temporally separable events that precede cell fusion upon myogenesis. J Cell Biol. 1996;132:657–666. - PMC - PubMed
    1. Auradé F, Pinset C, Chaffey P, Gros F, Montarras D. Myf-5, MyoD, Myogenin and MRF4myogenic derivatives of the embryonic mesenchymal cell line 10T1/2 exhibit the same adult phenotype. Differentiation. 1994;55:185–192. - PubMed
    1. Auradé F, Pfarr CM, Lindon C, Garcia A, Primig M, Montarras D, Pinset C. The glucocorticoid receptor and AP-1 are involved in a positive regulation of the muscle regulatory gene Myf-5 in cultured myoblasts. J Cell Sci. 1997;110:2771–2779. - PubMed

Publication types