

Evolution of envelope sequences from the genital tract and peripheral blood of women infected with clade A human immunodeficiency virus type 1
- PMID: 9733867
- PMCID: PMC110179
- DOI: 10.1128/JVI.72.10.8240-8251.1998
Evolution of envelope sequences from the genital tract and peripheral blood of women infected with clade A human immunodeficiency virus type 1
Abstract
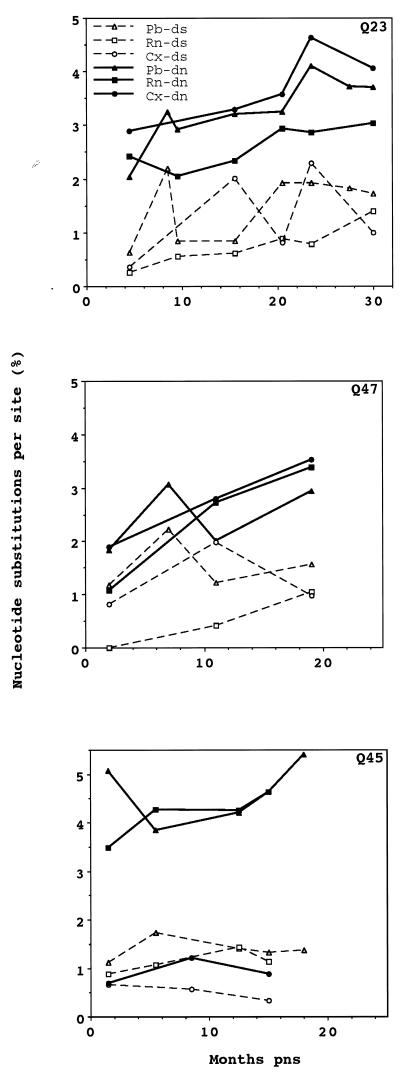
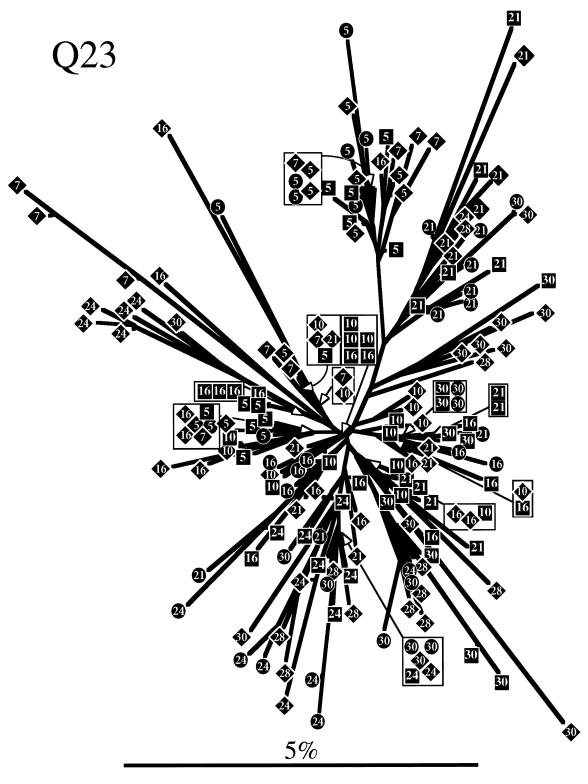
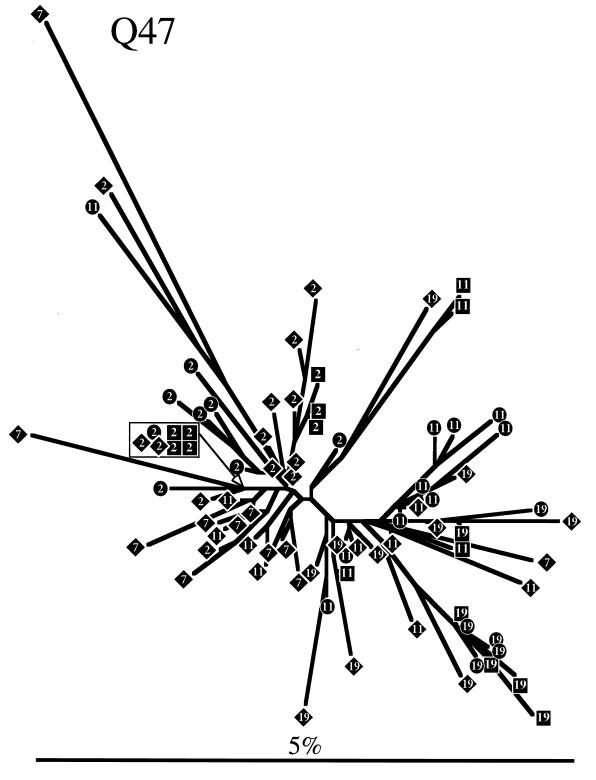
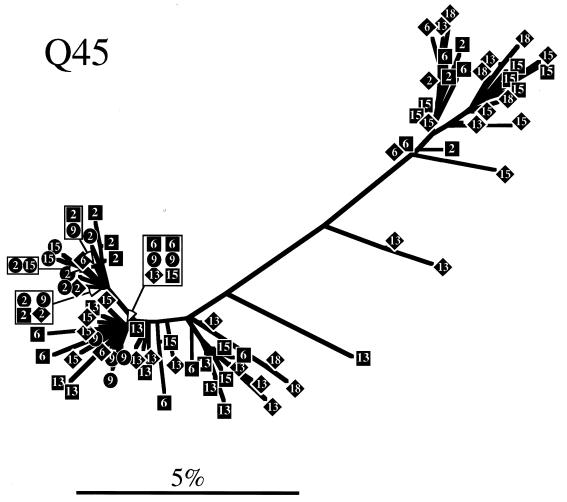
The development of viral diversity during the course of human immunodeficiency virus type 1 (HIV-1) infection may significantly influence viral pathogenesis. The paradigm for HIV-1 evolution is based primarily on studies of male cohorts in which individuals were presumably infected with a single virus variant of subtype B HIV-1. In this study, we evaluated virus evolution based on sequence information of the V1, V2, and V3 portions of HIV-1 clade A envelope genes obtained from peripheral blood and cervical secretions of three women with genetically heterogeneous viral populations near seroconversion. At the first sample following seroconversion, the number of nonsynonymous substitutions per potential nonsynonymous site (dn) significantly exceeded substitutions at potential synonymous sites (ds) in plasma viral sequences from all individuals. Generally, values of dn remained higher than values of ds as sequences from blood or mucosa evolved. Mutations affected each of the three variable regions of the envelope gene differently; insertions and deletions dominated changes in V1, substitutions involving charged amino acids occurred in V2, and sequential replacement of amino acids over time at a small subset of positions distinguished V3. The relationship among envelope nucleotide sequences obtained from peripheral blood mononuclear cells, plasma, and cervical secretions was evaluated for each individual by both phylogenetic and phenetic analyses. In all subjects, sequences from within each tissue compartment were more closely related to each other than to sequences from other tissues (phylogenetic tissue compartmentalization). At time points after seroconversion in two individuals, there was also greater genetic identity among sequences from the same tissue compartment than among sequences from different tissue compartments (phenetic tissue compartmentalization). Over time, temporal phylogenetic and phenetic structure was detectable in mucosal and plasma viral samples from all three women, suggesting a continual process of migration of one or a few infected cells into each compartment followed by localized expansion and evolution of that population.
Figures

Similar articles
-
Evidence for both Intermittent and Persistent Compartmentalization of HIV-1 in the Female Genital Tract.J Virol. 2019 May 1;93(10):e00311-19. doi: 10.1128/JVI.00311-19. Print 2019 May 15. J Virol. 2019. PMID: 30842323 Free PMC article.
-
Variability of human immunodeficiency virus-1 in the female genital reservoir during genital reactivation of herpes simplex virus type 2.Clin Microbiol Infect. 2015 Sep;21(9):873.e1-9. doi: 10.1016/j.cmi.2015.05.014. Epub 2015 May 21. Clin Microbiol Infect. 2015. PMID: 26003280 Clinical Trial.
-
Presence of multiple genetic subtypes of human immunodeficiency virus type 1 proviruses in Uganda.AIDS Res Hum Retroviruses. 1994 Nov;10(11):1543-50. doi: 10.1089/aid.1994.10.1543. AIDS Res Hum Retroviruses. 1994. PMID: 7888209
-
Human immunodeficiency virus type 1 V1-V2 envelope loop sequences expand and add glycosylation sites over the course of infection, and these modifications affect antibody neutralization sensitivity.J Virol. 2006 Oct;80(19):9586-98. doi: 10.1128/JVI.00141-06. J Virol. 2006. PMID: 16973562 Free PMC article.
-
The intra-host evolutionary and population dynamics of human immunodeficiency virus type 1: a phylogenetic perspective.Infect Dis Rep. 2013 Jun 6;5(Suppl 1):e3. doi: 10.4081/idr.2013.s1.e3. eCollection 2013 Jun 6. Infect Dis Rep. 2013. PMID: 24470967 Free PMC article. Review.
Cited by
-
The quasispecies nature and biological implications of the hepatitis C virus.Infect Genet Evol. 2009 Dec;9(6):1158-67. doi: 10.1016/j.meegid.2009.07.011. Epub 2009 Aug 8. Infect Genet Evol. 2009. PMID: 19666142 Free PMC article. Review.
-
Consistent viral evolutionary changes associated with the progression of human immunodeficiency virus type 1 infection.J Virol. 1999 Dec;73(12):10489-502. doi: 10.1128/JVI.73.12.10489-10502.1999. J Virol. 1999. PMID: 10559367 Free PMC article.
-
Virus population homogenization following acute human immunodeficiency virus type 1 infection.J Virol. 2002 Dec;76(23):11953-9. doi: 10.1128/jvi.76.23.11953-11959.2002. J Virol. 2002. PMID: 12414937 Free PMC article.
-
Correlation between CD4 T cell counts and virus compartmentalization in genital and systemic compartments of HIV-infected females.Virology. 2011 Sep 1;417(2):320-6. doi: 10.1016/j.virol.2011.06.018. Epub 2011 Jul 13. Virology. 2011. PMID: 21745672 Free PMC article.
-
Persistence of viral reservoirs in multiple tissues after antiretroviral therapy suppression in a macaque RT-SHIV model.PLoS One. 2013 Dec 18;8(12):e84275. doi: 10.1371/journal.pone.0084275. eCollection 2013. PLoS One. 2013. PMID: 24367650 Free PMC article.
References
-
- Albert J, Abrahamsson B, Nagy K, Aurelius E, Gaines H, Nystrom G, Fenyo E M. Rapid development of isolate-specific neutralizing antibodies after primary HIV-1 infection and consequent emergence of virus variants which resist neutralization by autologous sera. AIDS. 1990;4:107–112. - PubMed
-
- Arendrup M, Nielsen C, Hansen J-E S, Pedersen C, Mathiesen L, Nielsen J O. Autologous HIV-1 neutralizing antibodies: emergence of neutralization-resistant escape virus and subsequent development of escape virus neutralizing antibodies. J Acquired Immune Defic Syndr. 1992;5:303–307. - PubMed
-
- Barnett S W, Barboza A, Wilcox C M, Forsmark C E, Levy J A. Characterization of human immunodeficiency virus type 1 strains recovered from the bowel of infected individuals. Virology. 1991;182:802–809. - PubMed
-
- Bonhoeffer S, Holmes E C, Nowak M A. Causes of HIV diversity. Nature. 1995;376:125. . (Letter.) - PubMed
Publication types
MeSH terms
Substances
Associated data
- Actions
- Actions
- Actions
- Actions
- Actions
- Actions
- Actions
- Actions
- Actions
- Actions
- Actions
- Actions
- Actions
- Actions
- Actions
- Actions
- Actions
- Actions
- Actions
- Actions
- Actions
- Actions
- Actions
- Actions
- Actions
- Actions
- Actions
- Actions
- Actions
- Actions
Grants and funding
LinkOut - more resources
Full Text Sources
Medical
Molecular Biology Databases
