Comparative Study
. 1998 Aug 15;18(16):6093-102.
doi: 10.1523/JNEUROSCI.18-16-06093.1998.

Functional analysis of the mouse Scn8a sodium channel

Affiliations
Comparative Study

Functional analysis of the mouse Scn8a sodium channel

M R Smith et al. J Neurosci. .

Abstract

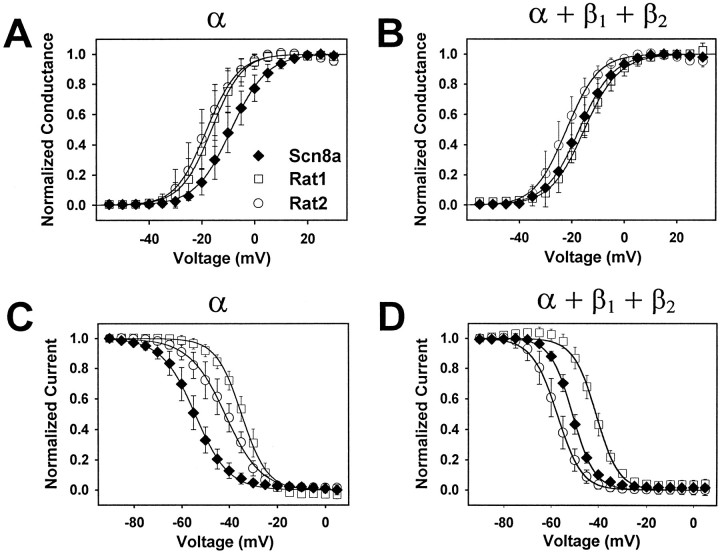
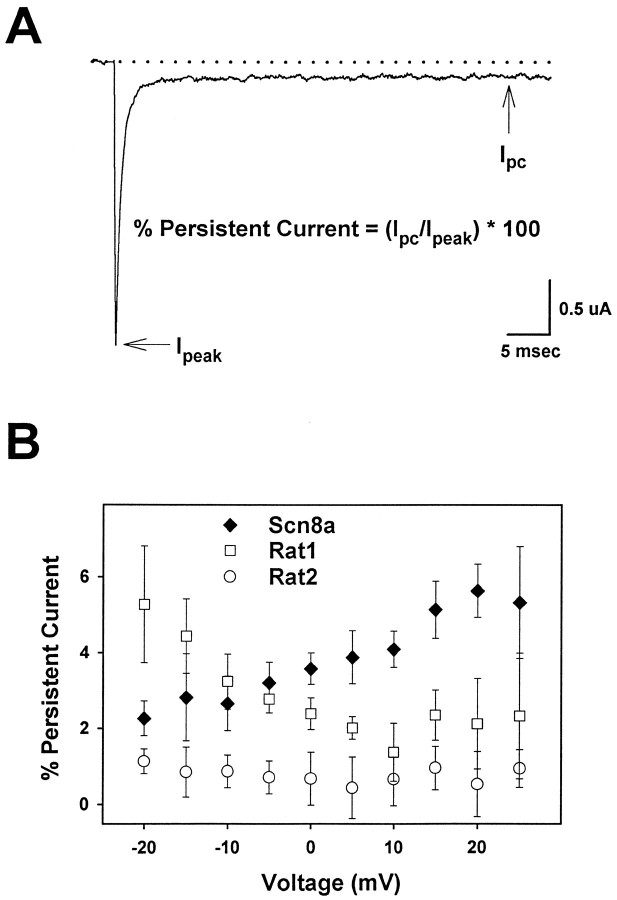
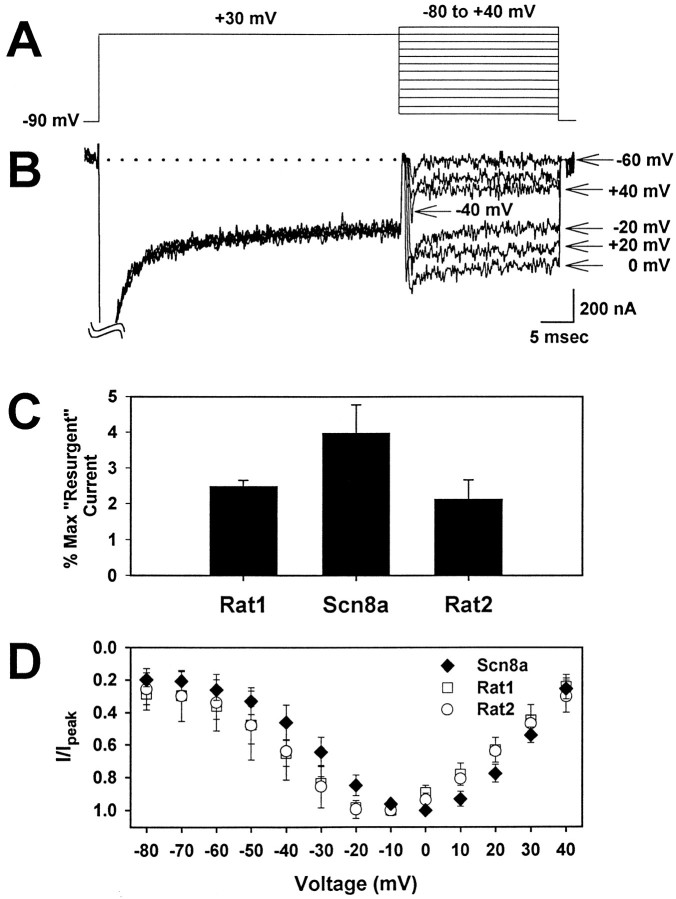
The mouse Scn8a sodium channel and its ortholog Na6 in the rat are abundantly expressed in the CNS. Mutations in mouse Scn8a result in neurological disorders, including paralysis, ataxia, and dystonia. In addition, Scn8a has been observed to mediate unique persistent and resurgent currents in cerebellar Purkinje cells (Raman et al., 1997). To examine the functional characteristics of this channel, we constructed a full-length cDNA clone encoding the mouse Scn8a sodium channel and expressed it in Xenopus oocytes. The electrophysiological properties of the Scn8a channels were compared with those of the Rat1 and Rat2 sodium channels. Scn8a channels were sensitive to tetrodotoxin at a level comparable to that of Rat1 or Rat2. Scn8a channels inactivated more rapidly and showed differences in their voltage-dependent properties compared with Rat1 and Rat2 when only the alpha subunits were expressed. Coexpression of the beta1 and beta2 subunits modulated the properties of Scn8a channels, but to a lesser extent than for the Rat1 or Rat2 channels. Therefore, all three channels showed similar voltage dependence and inactivation kinetics in the presence of the beta subunits. Scn8a channels coexpressed with the beta subunits exhibited a persistent current that became larger with increasing depolarization, which was not observed for either Rat1 or Rat2 channels. The unique persistent current observed for Scn8a channels is consistent with the hypothesis that this channel is responsible for distinct sodium conductances underlying repetitive firing of action potentials in Purkinje neurons.


Figures

Fig. 1.
Fig. 1.
Diagram of the Scn8a sodium channel.A, Diagram of the Scn8a sodium channel, showing the differences between the sequence of the cDNA clone described in this work and the previously published sequence (Burgess et al., 1995). The five amino acid differences are represented by the circledresidues, which indicate the sequence of the cDNA clone described here, compared with the originally published sequence shown in parentheses. The positions of the silent nucleotide differences are shown by the solid circles. The position of the 10-amino acid deletion resulting from alternative splicing is shown by the arrow. B, Amino acid sequence of the cytoplasmic linker between domains I and II. This sequence was not included in the work by Burgess et al. (1995), but it is identical to the sequence that was later determined for the mouse Scn8a channel by Plummer, Galt, Jones, Burgess, Sprunger, Kohrman, and Meisler (unpublished observations), and it differs at only one position (E in Scn8a compared with D in Rat6 at position 684) compared with the Rat6 (PN4) channel sequence that was determined by Dietrich et al. (1998). The 10 amino acids that are deleted in this spliced form are enclosed in a box.
Fig. 2.
Fig. 2.
Representative current traces for Scn8a, Rat1, and Rat2. Channels consisting of α subunits alone (A) or α subunits coexpressed with β1 and β2 subunits (B) were expressed in Xenopusoocytes as described in Materials and Methods. Currents were recorded using the cut-open oocyte voltage clamp at 20°C as described in Materials and Methods. Currents were elicited by membrane depolarizations ranging from −65 to +25 mV in 10 mV increments from a holding potential of −100 mV. The currents from α subunit channels are shown with a longer time axis to demonstrate inactivation kinetics of these channels, which was much slower than for the channels expressed with the β subunits. Calibration: 5 msec, 0.5 μA.
Fig. 3.
Fig. 3.
Time constants for fast inactivation of Scn8a, Rat1, and Rat2. Currents were recorded from oocytes expressing Scn8a, Rat1, or Rat2 sodium channels using the cut-open oocyte voltage clamp as described in the legend to Figure 2. The kinetics of inactivation were fit with a single- or double-exponential equation as described in Materials and Methods, and the time constants representing the slow and fast components are shown on a logarithmic scale in thetop and middle panels, respectively, for α subunits alone (A) and α +β1+ β2 (B). Scn8a is indicated by thesolid diamonds, Rat1 is indicated by open squares, and Rat2 is indicated by open circles. The bottom panel shows the percent of current inactivating with the fast component of inactivation. In all cases, the fraction of τfast plus the fraction of τslow equals 1. Values represent averages, and error bars indicate SDs. Sample sizes were Scn8a α, n = 5; Rat1 α, n = 7; Rat2 α, n = 9; Scn8a α + β1 + β2,n = 6; Rat1 α + β1 + β2, n = 7; and Rat2 α + β1 + β2, n = 6.
Fig. 4.
Fig. 4.
Recovery from fast inactivation of Scn8a, Rat1, and Rat2 sodium currents. Recovery from inactivation was measured with a two-electrode voltage clamp using a two-pulse protocol consisting of an initial conditioning pulse to −10 mV for 50 msec (which inactivated >95% of the channels), a variable recovery interval, and a test pulse to −10 mV to measure the amount of current that had recovered. Fractional recovery was calculated by dividing the current amplitude during the test pulse by the amplitude during the corresponding conditioning pulse. Fractional recovery is plotted on a log scale as a function of recovery time for α subunits alone (A) and α + β1 + β2(B). Scn8a is indicated by the solid diamonds, Rat1 is indicated by open squares, and Rat2 is indicated by open circles. Values represent averages, and error bars indicate SDs. The data were fit with a single-, double-, or triple-exponential equation as described in Materials and Methods, and the parameters of the fits and sample sizes are shown in Table 1.
Fig. 5.
Fig. 5.
Voltage dependence of activation and inactivation for Scn8a, Rat1, and Rat2 sodium channels. The voltage dependence of activation is shown for α subunits (A) alone and α + β1 + β2 (B). Sodium currents were recorded using a cut-open oocyte clamp and elicited by depolarizing pulses from a holding potential of −100 mV to potentials ranging from −55 to +30 mV in 5 mV increments. Conductance values were calculated by dividing the peak current amplitude by the driving force at each potential and normalizing to the maximum conductance, as described in Materials and Methods. Scn8a is indicated by the solid diamonds, Rat1 is indicated by open squares, and Rat2 is indicated by open circles. Values represent averages, and error bars indicate SDs. The data were fit with a two-state Boltzmann equation as described in Materials and Methods, and the parameters of the fits and sample sizes are shown in Table 1. The voltage dependence of inactivation is shown for α subunits alone (C) and α + β1 + β2(D). The voltage dependence of inactivation was determined using a two-step protocol in which a 500 msec conditioning pulse to potentials ranging from −90 to +5 mV was followed by a 25 msec test pulse to −10 mV to measure peak current amplitude. The peak current amplitude during the test pulse was normalized to the maxi-mum current amplitude and is plotted as a function of the conditioning pulse potential. Scn8a is indicated by the solid diamonds, Rat1 is indicated by open squares, and Rat2 is indicated by open circles. Values represent averages, and error bars indicate SDs. The data were fit with a two-state Boltzmann equation as described in Materials and Methods, and the parameters of the fits and sample sizes are shown in Table 1.
Fig. 6.
Fig. 6.
Voltage dependence of persistent current for Scn8a, Rat1, and Rat2 sodium channels. A, Representative current trace using a two-electrode voltage clamp of Scn8a + β1 + β2 channels during a depolarization to +25 mV. The percent of persistent current was calculated from TTX-subtracted current traces by measuring the persistent current remaining at 50 msec (Ipc) and dividing by the peak current (Ipeak) for each depolarization. B, The percent of persistent current is shown for Scn8a (solid diamonds), for Rat1 (open squares), and for Rat2 (open circles) over a voltage range from −20 to +25 mV in 5 mV increments. Channels were coexpressed with the β1 and β2 subunits. Values represent averages, and error bars indicate SDs. Sample sizes were Scn8a, n = 5; Rat1,n = 5; and Rat2, n = 5.
Fig. 7.
Fig. 7.
Possible resurgent current resulting from Scn8a, Rat1, and Rat2 channels. Channels were coexpressed with the β subunits as described in the legend to Figure 2. Oocytes expressing current levels of 8–30 μA were used to attain larger and more easily measurable potential resurgent currents, which were recorded using a two-electrode voltage clamp. A, The protocol used to elicit resurgent current consists of depolarization from a holding potential of −90 mV to a membrane depolarization of +30 mV for 48 msec followed by a range of depolarizations from −80 to +50 mV in 10 mV increments for 25 msec. B, Representative TTX subtracted current traces are shown for Scn8a channels during depolarizations from −60 to +40 mV in 20 mV increments. The vertical scale bar corresponds to 10% of the initial current evoked during the depolarization to +30 mV, which is off the scale. C, The percent of the peak potential resurgent current normalized to the peak initial current is shown. D, The potential resurgent currents during each depolarization were normalized to the peak current and plotted versus voltage for Scn8a (solid diamonds), Rat1 (open squares), and Rat2 (open circles). Values represent averages, and error bars indicate SDs. Sample sizes were Scn8a, n = 4; Rat1, n = 5; and Rat2, n = 4.

Similar articles

Cited by

References

    1. Auld VJ, Goldin AL, Krafte DS, Marshall J, Dunn JM, Catterall WA, Lester HA, Davidson N, Dunn RJ. A rat brain Na+ channel α subunit with novel gating properties. Neuron. 1988;1:449–461. - PubMed
    1. Beckh S, Noda M, Lübbert H, Numa S. Differential regulation of three sodium channel messenger RNAs in the rat CNS during development. EMBO J. 1989;8:3611–3636. - PMC - PubMed
    1. Black JA, Yokoyama S, Higashida H, Ransom BR, Waxman SG. Sodium channel mRNAs I, II, and III in the CNS: cell-specific expression. Mol Brain Res. 1994;22:275–289. - PubMed
    1. Burgess DL, Kohrman DC, Galt J, Plummer NW, Jones JM, Spear B, Meisler MH. Mutation of a new sodium channel gene, Scn8a, in the mouse mutant “motor endplate disease.”. Nat Genet. 1995;10:461–465. - PubMed
    1. Catterall WA. Cellular and molecular biology of voltage-gated sodium channels. Physiol Rev. 1992;72:S15–S48. - PubMed

Publication types