. 1998 Sep;72(9):7583-8.
doi: 10.1128/JVI.72.9.7583-7588.1998.

Migration of mitochondria to viral assembly sites in African swine fever virus-infected cells

Affiliations

Migration of mitochondria to viral assembly sites in African swine fever virus-infected cells

G Rojo et al. J Virol. 1998 Sep.

Abstract

An examination by electron microscopy of the viral assembly sites in Vero cells infected with African swine fever virus showed the presence of large clusters of mitochondria located in their proximity. These clusters surround viral factories that contain assembling particles but not factories where only precursor membranes are seen. Immunofluorescence microscopy revealed that these accumulations of mitochondria are originated by a massive migration of the organelle to the virus assembly sites. Virus infection also promoted the induction of the mitochondrial stress-responsive proteins p74 and cpn 60 together with a dramatic shift in the ultrastructural morphology of the mitochondria toward that characteristic of actively respiring organelles. The clustering of mitochondria around the viral factory was blocked in the presence of the microtubule-disassembling drug nocodazole, indicating that these filaments are implicated in the transport of the mitochondria to the virus assembly sites. The results presented are consistent with a role for the mitochondria in supplying the energy that the virus morphogenetic processes may require and make of the African swine fever virus-infected cell a paradigm to investigate the mechanisms involved in the sorting of mitochondria within the cell.


Figures
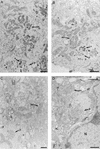
FIG. 1
FIG. 1
Viral assembly sites in ASFV-infected Vero cells. The cells were cultured in Dulbecco’s modified Eagle’s medium supplemented with 10% newborn calf serum and infected with the BA71V isolate as described in the text. At 12 hpi, the cells were fixed with 2% glutaraldehyde and 2% tannic acid, dehydrated in ethanol, and stained with 2% uranyl acetate. After embedding in Epon, thin sections (80 nm) were cut, stained with 2% lead citrate, and examined under a Jeol 1010 electron microscope. (A) The micrograph shows a factory (F) that contains viral membranes and assembling particles (v). A large cluster of mitochondria (mt) is located in proximity to the factory. (B) Viral factory (F) containing membranes and assembling particles (v). The mitochondria (mt) are located very close to the virus particles. (C and D) Viral assembling sites (F) containing only precursor membranes. Few mitochondria (mt) are seen near the factories. Note also the different morphology of mitochondria in cells containing early (C and D) and late (A and B) viral assembly sites. (D) N, nucleus. (A, B, and D) Bar, 1 μm; (C) bar, 0.5 μm.
FIG. 2
FIG. 2
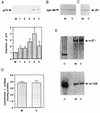
Assay of mitochondrial proteins and DNA in ASFV-infected cells. (A) Vero cells were mock infected or infected with ASFV, and, at different times postinfection, whole-cell extracts were prepared, fractionated in sodium dodecyl sulfate–10% polyacrylamide gels, and transferred to nylon membranes. The membranes were probed as described previously (19, 37) with a 1:200 dilution of a serum which has been shown to specifically recognize the mitochondrial stress-responsive p74 (1, 9). M, mock-infected cells. The infected cells were collected at 2 (lane 1), 6 (lane 2), 12 (lane 3), 18 (lane 4), and 24 (lane 5) hpi. The histogram at the bottom of the panel illustrates the p74 induction after quantification by densitometric scanning. Each bar represents the mean of six experiments (error bar, standard error of the mean). (B and C) Same as panel A, but with antibodies against cpn 60 (StressGene) and β-F1-ATPase protein (37), respectively. Densitometric scanning of the bands shown in panel B indicated a threefold increase in the cpn 60 contents in the infected cells. Lanes M, mock-infected cells; lanes V, ASFV-infected cells at 16 hpi. (D) Cytochrome c oxidase activity in mock-infected (M) and ASFV-infected (V) cells was assayed in whole-cell extracts at 16 hpi as described previously (37). The activity is expressed in milliunits per milligram of protein. Each bar represents the mean of five experiments (error bar, standard error of the mean). (E) Vero cells were mock infected (M) or infected with ASFV (V) and, at 16 hpi, the total cell DNA was extracted, digested with BamHI, and subjected to electrophoresis in an agarose gel. After transfer to nitrocellulose membranes, the amount of nuclear DNA present in the samples was estimated by hybridization to a 32P-labeled DNA probe specific for the rat liver β-F1-ATPase gene (11). The bands corresponding to mock- and virus-infected cells were analyzed by densitometry, and the membrane was then stripped and hybridized to a probe corresponding to the gene coding for the 12S mitochondrial rRNA from rat liver (10). After densitometry was performed on the bands obtained, the amount of mitochondrial DNA in the samples was quantified by calculating the ratio of the densitometric value of the mitochondrial DNA to that of the nuclear DNA. The values for these ratios were the following: mock-infected cells, 0.37; and infected cells, 0.32. Hybridization to BamHI-digested rat liver DNA, used as a control (C) is also shown.
FIG. 3
FIG. 3
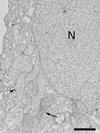
Mitochondrial ultrastructure in mock-infected Vero cells. Mitochondria with the orthodox ultrastructure corresponding to a resting state (arrowhead) predominate over mitochondria with the condensed morphology of actively respiring organelles (arrow). N, nucleus. Bar, 1 μm.
FIG. 4
FIG. 4
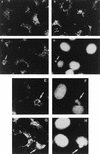
Distribution of mitochondria in mock-infected and ASFV-infected Vero cells. The cells were grown in chamber slides (Lab-Tek; Nunc), mock infected or infected as described in this work and, at different times postinfection, fixed with methanol at −20°C for 5 min. The samples were then incubated for 1 h at 37°C with a 1:10 dilution of a rabbit antiserum against the mitochondrial F1-ATPase (37). After being washed with 0.1% bovine serum albumin in phosphate-buffered saline, the cells were incubated for 1 h at 37°C with a 1:100 dilution of a donkey anti-rabbit antibody conjugated to fluorescein (Amersham). The samples were finally stained with 5 μg of bisbenzimide (Hoechst 33258; Sigma) per ml of phosphate-buffered saline for 5 min at 37°C to visualize the nuclear and viral DNA and examined with an Axiovert fluorescence microscope (Carl Zeiss, Inc., Oberkochen, Germany). (A) Mitochondrial pattern in mock-infected cells. (B) Pattern in infected cells at 8 hpi. (C) Infected cells at 14 hpi. The arrow points to a ring-shaped mitochondrial fluorescent signal in a cell. (D) DNA staining pattern of the field shown in panel C. The arrow indicates the area of a cytoplasmic viral factory as defined by DNA staining. Notice that the fluorescent signal in panel C encircles the area of the factory. (E) Mitochondrial pattern in infected cells at 14 hpi. Two closely located mitochondrial rings are indicated by an arrow. The rings encircle the viral factories shown in panel F (arrow). (G) Infected cells at 16 hpi. The mitochondrial fluorescent signal indicated by an arrow surrounds the factory shown in panel H (H) DNA staining of the field shown in panel G. The arrow indicates the viral factory.
FIG. 5
FIG. 5
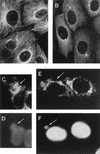
Effect of nocodazole on the microtubule and mitochondrial patterns in Vero cells. (A) Microtubule pattern in uninfected Vero cells. The cells were fixed with methanol at −20°C for 5 min and then incubated for 1 h at 37°C with a 1:500 dilution of a mouse antiserum against tubulin (Sigma). After being washed with 0.1% bovine serum albumin in phosphate-buffered saline the cells were incubated for 1 h at 37°C with a 1:100 dilution of a Texas Red-coupled anti-mouse antibody (Amersham). (B) Tubulin pattern in uninfected Vero cells treated with nocodazole. The cells were incubated with 10 μM nocodazole for 1 h and then processed as described for panel A. (C) Mitochondrial pattern in infected Vero cells in the absence of nocodazole. The cells were infected as indicated in the legend to Fig. 4, and, at 14 hpi, they were fixed and incubated with the antiserum against the mitochondrial F1-ATPase as described in this work. The arrow indicates the mitochondrial clustering around a viral factory. (D) DNA staining pattern of the field shown in panel C. The arrow points to the viral factory. (E) The cells were infected as described for panel C, and, at 6 hpi, 10 μM nocodazole was added to the cultures. The cells were fixed at 14 hpi and incubated with the anti-F1-ATPase serum. The arrow points to a cell containing a viral factory. (F) DNA staining pattern of the field shown in panel E. The arrow points to the factory of the cell indicated in panel E.

Similar articles

Cited by

References

    1. Alconada A, Flores A I, Blanco L, Cuezva J M. Antibodies against F1-ATPase α-subunit recognize mitochondrial chaperones. Evidence for an evolutionary relationship between chaperonin and ATPase protein families. J Biol Chem. 1994;269:13670–13679. - PubMed
    1. Andrés G, Simón-Mateo C, Viñuela E. Assembly of African swine fever virus: role of polyprotein pp220. J Virol. 1997;71:2331–2341. - PMC - PubMed
    1. Andrés, G. Personal communication.
    1. Brady S T. A novel brain ATPase with properties expected for the fast axonal transport motor. Nature. 1985;317:73–75. - PubMed
    1. Brady S T, Lasek R J, Allen R D. Fast axonal transport in extruded axoplasm from squid giant axon. Science. 1982;218:1129–1131. - PubMed

Publication types

Substances