. 1998 Jul 27;142(2):587-94.
doi: 10.1083/jcb.142.2.587.

Integrin alpha1beta1 mediates a unique collagen-dependent proliferation pathway in vivo

Affiliations

Integrin alpha1beta1 mediates a unique collagen-dependent proliferation pathway in vivo

A Pozzi et al. J Cell Biol. .

Abstract

Activation of integrins upon binding to extracellular matrix proteins is believed to be a crucial step for the regulation of cell survival and proliferation. We have used integrin alpha1-null mice to investigate the role of this collagen receptor in the regulation of cell growth and survival in vivo. alpha1-deficient animals, which are viable and fertile, have a hypocellular dermis and a deficiency in dermal fibroblast proliferation as embryos. In vitro analysis of alpha1-null embryonic fibroblasts has revealed that their proliferation rate is markedly reduced when plated on collagenous substrata, despite normal attachment and spreading. Moreover, on the same collagenous matrices, alpha1-null fibroblasts fail to recruit and activate the adaptor protein Shc. The failure to activate Shc is accompanied by a downstream deficiency in recruitment of Grb2 and subsequent mitogen-activated protein kinase activation. Taken together with the growth deficiency observed on collagens, this finding indicates that the alpha1beta1 is the sole collagen receptor which can activate the Shc mediated growth pathway. Thus, integrin alpha1 has a unique role among the collagen receptors in regulating both in vivo and in vitro cell proliferation in collagenous matrices.


Figures

Figure 1
Figure 1
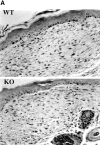
Fibroblast density in dermis of wild-type and α1-deficient animals. (A) Representative sections of wild-type (WT) and α1-deficient (KO) 6-wk-old skin stained with hematoxylin and eosin. The α1-deficient skin has apparently normal architecture but reduced numbers of nuclei in the dermis. (B) Counts of dermal nuclei in pairs of wild-type and knockout skin obtained from 6-, 12-, and 24-wk-old 129 Sv/ter mice. Each pair of bars represents one pair of apposed sections of back skin sectioned at 5 μm. Note the lower number of dermal nuclei in α1-null dermis compared with that observed in wild-type samples. Bars and errors show mean and standard deviation of counts of dermal nuclei in six high power field views of dermis. Differences between wild-type and α1-null groups were significant with P < 0.05 by Student's t test in each case. Bar, 100 μm.
Figure 1
Figure 1
Fibroblast density in dermis of wild-type and α1-deficient animals. (A) Representative sections of wild-type (WT) and α1-deficient (KO) 6-wk-old skin stained with hematoxylin and eosin. The α1-deficient skin has apparently normal architecture but reduced numbers of nuclei in the dermis. (B) Counts of dermal nuclei in pairs of wild-type and knockout skin obtained from 6-, 12-, and 24-wk-old 129 Sv/ter mice. Each pair of bars represents one pair of apposed sections of back skin sectioned at 5 μm. Note the lower number of dermal nuclei in α1-null dermis compared with that observed in wild-type samples. Bars and errors show mean and standard deviation of counts of dermal nuclei in six high power field views of dermis. Differences between wild-type and α1-null groups were significant with P < 0.05 by Student's t test in each case. Bar, 100 μm.
Figure 2
Figure 2
Proliferative index of wild-type and α1-null embryonic dermal fibroblasts. (A) Mid cross-section of 16.5 embryos were stained with anti-PCNA antibodies, and subsequently counterstained with hematoxylin. Note the higher number of dermal PCNA-positive cells in the wild-type (WT) dermis, as compared with their α1-null (KO) counterparts. (B) The dermal proliferative index (number of PCNA positive cells/total number of cells × 100) of three wild-type and three α1-null 16.5 embryos was determined by random evaluation of 12 different 40× microscopic fields for each sample, counting a minimum of 900 cells around the entire circumference of embryonal dermis. Bars and errors indicate the mean and standard deviation. Differences between wild-type and α1-null groups were significant with P < 0.05 by Student's t test. Bar, 30 μm.
Figure 2
Figure 2
Proliferative index of wild-type and α1-null embryonic dermal fibroblasts. (A) Mid cross-section of 16.5 embryos were stained with anti-PCNA antibodies, and subsequently counterstained with hematoxylin. Note the higher number of dermal PCNA-positive cells in the wild-type (WT) dermis, as compared with their α1-null (KO) counterparts. (B) The dermal proliferative index (number of PCNA positive cells/total number of cells × 100) of three wild-type and three α1-null 16.5 embryos was determined by random evaluation of 12 different 40× microscopic fields for each sample, counting a minimum of 900 cells around the entire circumference of embryonal dermis. Bars and errors indicate the mean and standard deviation. Differences between wild-type and α1-null groups were significant with P < 0.05 by Student's t test. Bar, 30 μm.
Figure 3
Figure 3
Proliferative index of wild-type and α1-null adult fibroblasts in wounded dermis. (A) Sections of wild-type (WT) and α1-deficient (KO) wounded skin, 12 d after incision and primary closure, stained with anti-PCNA antibodies, and subsequently counterstained with hematoxylin. The proportion of PCNA-positive cells in the dermal wound (seen as dark nuclei in the micrograph) was similar in wild-type and α1-null animals. (B) The dermal proliferative index (number of PCNA positive cells/total number of cells × 100) was determined by random evaluation of 3 different 40× microscopic fields for each sample, counting a minimum of 300 cells. Bars and errors indicate the mean and standard deviation. Bar, 100 μm.
Figure 3
Figure 3
Proliferative index of wild-type and α1-null adult fibroblasts in wounded dermis. (A) Sections of wild-type (WT) and α1-deficient (KO) wounded skin, 12 d after incision and primary closure, stained with anti-PCNA antibodies, and subsequently counterstained with hematoxylin. The proportion of PCNA-positive cells in the dermal wound (seen as dark nuclei in the micrograph) was similar in wild-type and α1-null animals. (B) The dermal proliferative index (number of PCNA positive cells/total number of cells × 100) was determined by random evaluation of 3 different 40× microscopic fields for each sample, counting a minimum of 300 cells. Bars and errors indicate the mean and standard deviation. Bar, 100 μm.
Figure 4
Figure 4
Growth of wild-type and α1-deficient embryonic fibroblasts on different substrata. 10 × 104 log phase wild-type (□) and α1-null (•) EFs were plated in presence of 2% FCS (A) or 10% FCS (B) on 24-well plates uncoated, or coated with fibrinogen (10 μg/ml), collagen I (100 μg/ml), or a mixture of collagen I (100 μg/ml) and IV (30 μg/ml). Two wells per group for each treatment were counted at the time point indicated. This experiment is representative of three repeated experiments. Note the reduced growth of α1-null EFs, on collagen-coated dishes, as compared with the wild-type cells. Bars and errors indicate the mean and the higher number from two dishes per each group.
Figure 5
Figure 5
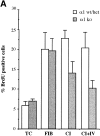
Profilerative index of wild-type and α1-null embryonic fibroblasts in vitro. (A) EFs were plated in presence of 2% FCS onto dishes uncoated or coated with fibrinogen (10 μg/ml), collagen I (100 μg/ml), or a mixture of collagen I (100 μg/ml) and collagen IV (30 μg/ml). 24 h after plating, cells were labeled with 10 μM BrdU (Sigma Chemical Co.), and incubated for a further 24 h. After staining with anti-BrdU mAbs, the Brdu labeling index (positive cells/total number of counted cells × 100) was determined by random evaluation of five different 40× microscopic fields for each duplicate sample, counting a minimum of 200 cells. Bars and errors indicate the mean and standard deviation. The differences seen between wild-type and α1-null groups on collagens are significant with P < 0.05 using a Student's t-test on the 10 microscopic fields counted for each sample. (B) S phase entry of wild-type and α1-null embryonic fibroblasts after serum starvation. Passage 4 EFs were starved for 24 h, before plating on various substrata in the presence of 2% FCS. After 12 h cells were recovered by trypsinization, and subjected to FACS® analysis as described in Materials and Methods. Bars indicate the mean and error bars the distance to the higher value for each pair of samples analyzed. TC, tissue culture; FN, fibronectin; FIB, fibrinogen; CI, collagen I; CI + IV, collagen I + IV; ST, serum starved.
Figure 5
Figure 5
Profilerative index of wild-type and α1-null embryonic fibroblasts in vitro. (A) EFs were plated in presence of 2% FCS onto dishes uncoated or coated with fibrinogen (10 μg/ml), collagen I (100 μg/ml), or a mixture of collagen I (100 μg/ml) and collagen IV (30 μg/ml). 24 h after plating, cells were labeled with 10 μM BrdU (Sigma Chemical Co.), and incubated for a further 24 h. After staining with anti-BrdU mAbs, the Brdu labeling index (positive cells/total number of counted cells × 100) was determined by random evaluation of five different 40× microscopic fields for each duplicate sample, counting a minimum of 200 cells. Bars and errors indicate the mean and standard deviation. The differences seen between wild-type and α1-null groups on collagens are significant with P < 0.05 using a Student's t-test on the 10 microscopic fields counted for each sample. (B) S phase entry of wild-type and α1-null embryonic fibroblasts after serum starvation. Passage 4 EFs were starved for 24 h, before plating on various substrata in the presence of 2% FCS. After 12 h cells were recovered by trypsinization, and subjected to FACS® analysis as described in Materials and Methods. Bars indicate the mean and error bars the distance to the higher value for each pair of samples analyzed. TC, tissue culture; FN, fibronectin; FIB, fibrinogen; CI, collagen I; CI + IV, collagen I + IV; ST, serum starved.
Figure 6
Figure 6
Apoptotic index of wild-type and α1-null EFs in vitro. (A) EFs were plated in absence of serum on coverslips coated with collagen I (20 μg/ml) or fibrinogen (10 μg/ ml). 16 h after plating, coverslips were washed to remove unattached cells, fixed, and then stained with 0.5 μg/ml DAPI. Chromatin condensation was used to score positive apoptotic cells. Note the higher number of apoptotic-positive cells in α1-null EFs as compared with wild-type cells when plated on collagen matrix. (B) The apoptotic index (cells with condensed chromatin/total number of counted cells × 100) of EFs, kept in suspension or plated in dishes coated as indicated, was determined by random evaluation of five different 40× microscopic fields for each duplicate sample, counting a minimum of 300 cells. Bars and errors indicate the mean and standard deviation. Significant differences were seen between wild-type and α1-null groups on collagens with P < 0.05 using a Student's t-test on the 10 microscopic fields counted for each sample. SUSP, suspension; FIB, fibrinogen; CI, collagen I; C I + IV, collagen I + IV. Bar, 40 μm.
Figure 6
Figure 6
Apoptotic index of wild-type and α1-null EFs in vitro. (A) EFs were plated in absence of serum on coverslips coated with collagen I (20 μg/ml) or fibrinogen (10 μg/ ml). 16 h after plating, coverslips were washed to remove unattached cells, fixed, and then stained with 0.5 μg/ml DAPI. Chromatin condensation was used to score positive apoptotic cells. Note the higher number of apoptotic-positive cells in α1-null EFs as compared with wild-type cells when plated on collagen matrix. (B) The apoptotic index (cells with condensed chromatin/total number of counted cells × 100) of EFs, kept in suspension or plated in dishes coated as indicated, was determined by random evaluation of five different 40× microscopic fields for each duplicate sample, counting a minimum of 300 cells. Bars and errors indicate the mean and standard deviation. Significant differences were seen between wild-type and α1-null groups on collagens with P < 0.05 using a Student's t-test on the 10 microscopic fields counted for each sample. SUSP, suspension; FIB, fibrinogen; CI, collagen I; C I + IV, collagen I + IV. Bar, 40 μm.
Figure 7
Figure 7
α1-null EFs fail to recruit and activate Shc and subsequent downstream events when plated on collagens. EFs were serum starved for 8 h and then trypsinized. Cells were then resuspended in DME/0.1% BSA and kept at room temperature for 30 min. They were then either left in suspension or plated on dishes coated with fibronectin (10 μg/ml), collagen I (20 μg/ml), or a mixture of collagen I (20 μg/ml) and IV (10 μg/ml). After 1 h at 37°C, cells were lysed and an equal amount of proteins were immunoprecipitated with anti-Shc polyclonal antibody (A–C), and subjected to immunoblotting with anti-Shc polyclonal antibody (A), anti–P-Tyr mAb (B), or anti–Grb-2 mAb (C). In D, equal amount of proteins were immunoprecipitated with anti-ERK2 polyclonal antibody and subjected to in vitro kinase assay with myelin basic protein as substrate. Note that when plated on collagens, α1-null EFs fail to phosphorylate Shc (B) or to activate events downstream of Shc (C and D), despite containing normal level of Shc protein (A). SUSP, suspension; FN, fibronectin; CI, collagen I; C I + IV, collagen I + IV.

Similar articles

Cited by

References

    1. Adams JC, Watt FM. Regulation of development and differentiation by the extracellular matrix. Development (Camb) 1993;117:1183–1198. - PubMed
    1. Broberg A, Heino J. Integrin α2β1-dependent contraction of floating collagen gels and induction of collagenase are inhibited by tyrosine kinase inhibitors. Exp Cell Res. 1996;228:29–35. - PubMed
    1. Chen HC, Guan JL. Association of focal adhesion kinase with its potential substrate phosphatidylinositol 3-kinase. Proc Natl Acad Sci USA. 1994;91:10148–10152. - PMC - PubMed
    1. Clark EA, Brugge JS. Integrins and signal transduction pathways: the road taken. Science. 1995;268:233–239. - PubMed
    1. Clark EA, Hynes RO. 1997 Keystone symposium on signal transduction by cell adhesion receptors. Biochim Biophys Acta. 1997;1333:9–16. - PubMed

Publication types

MeSH terms