. 1998 Jul 21;95(15):8585-9.
doi: 10.1073/pnas.95.15.8585.

Gating modifier toxins reveal a conserved structural motif in voltage-gated Ca2+ and K+ channels

Affiliations

Gating modifier toxins reveal a conserved structural motif in voltage-gated Ca2+ and K+ channels

Y Li-Smerin et al. Proc Natl Acad Sci U S A. .

Abstract

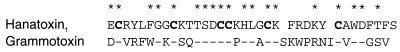
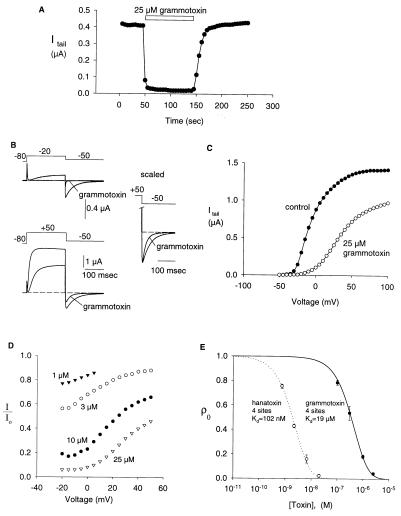
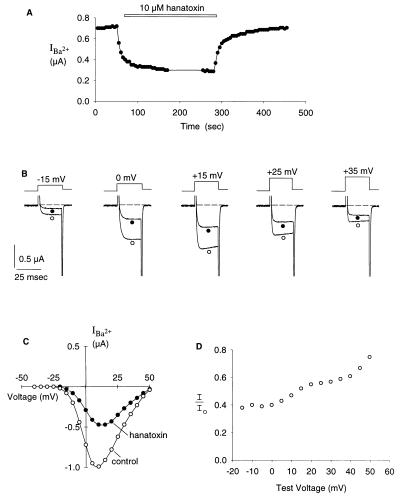
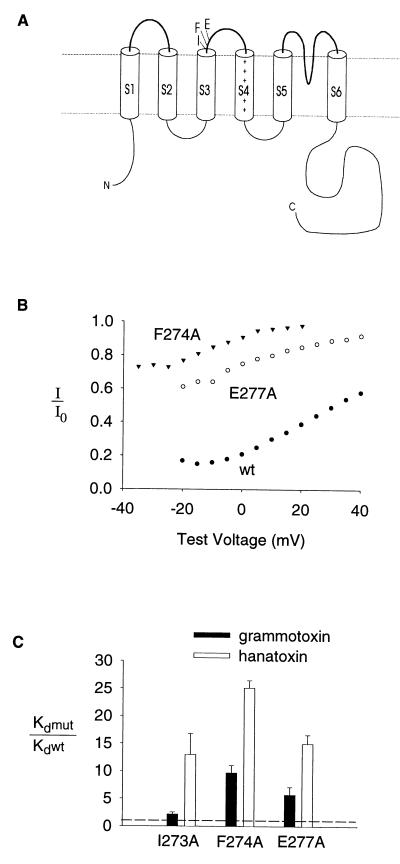
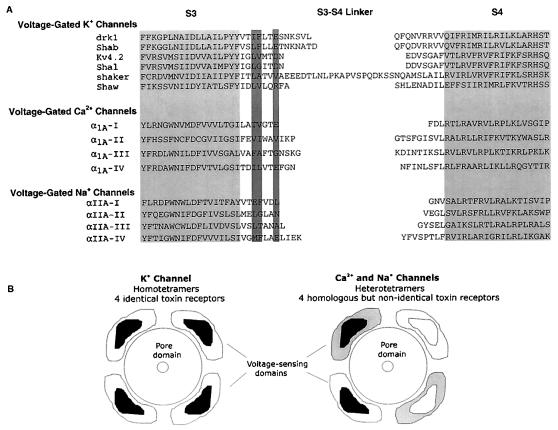
Protein toxins from venomous animals exhibit remarkably specific and selective interactions with a wide variety of ion channels. Hanatoxin and grammotoxin are two related protein toxins found in the venom of the Chilean Rose Tarantula, Phrixotrichus spatulata. Hanatoxin inhibits voltage-gated K+ channels and grammotoxin inhibits voltage-gated Ca2+ channels. Both toxins inhibit their respective channels by interfering with normal operation of the voltage-dependent gating mechanism. The sequence homology of hanatoxin and grammotoxin, as well as their similar mechanism of action, raises the possibility that they interact with the same region of voltage-gated Ca2+ and K+ channels. Here, we show that each toxin can interact with both voltage-gated Ca2+ and K+ channels and modify channel gating. Moreover, mutagenesis of voltage-gated K+ channels suggests that hanatoxin and grammotoxin recognize the same structural motif. We propose that these toxins recognize a voltage-sensing domain or module present in voltage-gated ion channels and that this domain has a highly conserved three-dimensional structure.


Figures

Figure 1
Figure 1
Amino acid sequence of hanatoxin1 (12) and grammotoxin (15). Dashes indicate identity with hanatoxin1. Asterisks above the sequence indicate conservation among the toxins.
Figure 2
Figure 2
Grammotoxin inhibition of the drk1Δ7 K+ channel. (A) Time course of inhibition of K+ channel current by 25 μM grammotoxin. The amplitude of tail currents measured at −50 mV after a weak 200 msec depolarization to −15 mV is plotted against time. Pulses were given every 5 sec. Holding voltage was −80 mV. (B) Traces showing currents elicited by either weak depolarization to −20 mV (Top) or strong depolarization to +50 mV (Bottom) in both the absence and presence of 25 μM grammotoxin. The two scaled traces on the Right show the kinetics of deactivation after strong depolarization to +50 mV. Small background conductances were subtracted using 10 nM agitoxin2 (>100 times Kd) to selectively block the drk1Δ7 K+ channel. (C) Tail current amplitude measured at −50 mV plotted as a function of the voltage of the preceding depolarization in either the absence or presence of 25 μM grammotoxin. Holding voltage was −80 mV. Test depolarizations were 200 msec in duration. Tail current amplitude was measured 2 msec after beginning the repolarization to −50 mV. Small background conductances were subtracted using 10 nM agitoxin2 to selectively block the drk1Δ7 K+ channel. (D) Fraction of uninhibited tail current elicited by various strength depolarizations for different grammotoxin concentrations. Tail current amplitude in the presence of grammotoxin (I) and tail current in control (Io). All tail currents were elicited by repolarization to −50 mV. Test depolarizations were 200 msec in duration from a holding voltage of −80 mV. (E) Plot of probability unbound (ρ0) against grammotoxin concentration. ρ0, the probability of the channel having zero grammotoxin molecules bound to it, equals the fraction of uninhibited tail current at negative voltages. Fraction of uninhibited tail current was measured in the plateau phase of the relations shown in D, typically after depolarization from −20 mV. Data points are mean ± SEM. n = 3–5 for all data points. Solid line is a fit of the data to ρ0 = (1 − P)4, where formula image with Kd = 19 μM. This equation assumes four equivalent and independent binding sites. Data and a fit to the same equation are shown for hanatoxin for purposes of comparison. Data for hanatoxin are from ref. .
Figure 3
Figure 3
Hanatoxin inhibition of the α1A voltage-gated Ca2+ channel. (A) Time course of inhibition of Ca2+ channel current by 10 μM hanatoxin. Amplitude of steady-state test current after depolarization to 0 mV plotted against time. Pulses were given every 5 sec. Holding voltage was −80 mV. (B) Traces showing currents elicited by various strength depolarizations in either the absence (○) or presence of 10 μM hanatoxin (•). Traces are shown unsubtracted. Within the voltage range examined, the leak currents observed after block of Ca2+ channels with Cd2+ were very small (<10 nA). (C) Steady-state current voltage relationship in either the presence or absence of 10 μM hanatoxin. Steady-state currents were measured 10 msec after depolarization. Holding voltage was −80 mV. Test pulses were 25 msec in duration. (D) Fraction of uninhibited current elicited by various strength depolarizations for 10 μM hanatoxin. Steady-state test current amplitude in the presence of grammotoxin (I) and steady-state test current in control (Io). Current amplitude was measured 10 msec after depolarization to the indicated test voltage. If a single site for hanatoxin exists on the α1A channel, then the plateau value for the fraction of uninhibited current (0.4) corresponds to a Kd for the toxin of ≈7 μM. Although unlikely (see Discussion), if there are four equivalent sites for hanatoxin, then the fraction of uninhibited current (0.4) would correspond to a Kd for the toxin of ≈40 μM.
Figure 4
Figure 4
Mutation of residues in the S3–S4 linker alters the binding affinity of grammotoxin to the drk1 K+ channel. (A) Membrane folding model of a single K+ channel α subunit showing the location of three residues at the C-terminal end of S3 that influence hanatoxin-binding affinity (14). (B) Fraction of uninhibited tail current elicited by various strength depolarizations at 10 μM grammotoxin for F274A, E277A and the wild-type channel. Tail current amplitude in the presence of 10 μM grammotoxin (I) and tail current in control (Io). All tail currents were elicited by repolarization to −50 mV. Test depolarizations were 250 msec in duration from a holding voltage of −80 mV. (C) Equilibrium dissociation constants (Kd) for grammotoxin binding to mutant drk1 K+ channels shown as a fraction of the Kd for grammotoxin binding to the wild-type drk1 K+ channel. Kd values for grammotoxin (mean ± SEM; n = 3–5) were calculated from the fraction of uninhibited current at negative voltages as previously described for hanatoxin (13) and shown in Fig. 2 and legend. Data for hanatoxin from ref. are shown for comparison.
Figure 5
Figure 5
(A) Alignment of various voltage-gated ion channels in a region spanning from S3 through S4. Light shading indicates proposed transmembrane segments. Dark shading highlights the position of residues that when mutated in the drk1 K+ channel alters hanatoxin- and grammotoxin-binding affinity (14, Fig. 4). Amino acid sequence for α1A is from ref. , and the sequence for αIIA is from ref. . (B) Diagram illustrating voltage-sensing domains (with toxin receptors contained within) and some differences that likely exist between voltage-gated K+, Ca2+, and Na+ channels. Voltage-sensing domains are drawn as modules that surround the pore domain. K+ channels studied experimentally are tetramers of four identical subunits. Each subunit contains a voltage-sensing domain to which a toxin binds. The toxin receptor is located at least 10–15 Å from the central pore axis. Ca2+ and Na+ channels are heterotetramers that contain four homologous but different pseudosubunits, each containing a voltage-sensing domain that likely binds gating modifier toxins with different energetics. Toxin receptors are arbitrarily drawn as contained within each subunit; receptors could be at the interface between subunits.

Similar articles

Cited by

References

    1. MacKinnon R, Miller C. J Gen Physiol. 1988;91:335–349. - PMC - PubMed
    1. Miller C. Neuron. 1988;1:1003–1006. - PubMed
    1. MacKinnon R, Miller C. Science. 1989;245:1382–1385. - PubMed
    1. Park C-S, Miller C. Neuron. 1992;9:307–313. - PubMed
    1. Stocker M, Pongs O, Hoth M, Heinemann S H, Stuhmer W, Schroter K H, Ruppersberg J P. Proc R Soc London. 1991;245:101–107. - PubMed

Publication types

LinkOut - more resources