

HIV-1 antigen-specific and -nonspecific B cell responses are sensitive to combination antiretroviral therapy
- PMID: 9670036
- PMCID: PMC2212446
- DOI: 10.1084/jem.188.2.233
HIV-1 antigen-specific and -nonspecific B cell responses are sensitive to combination antiretroviral therapy
Abstract
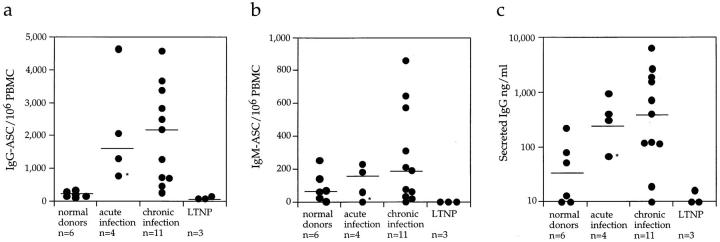
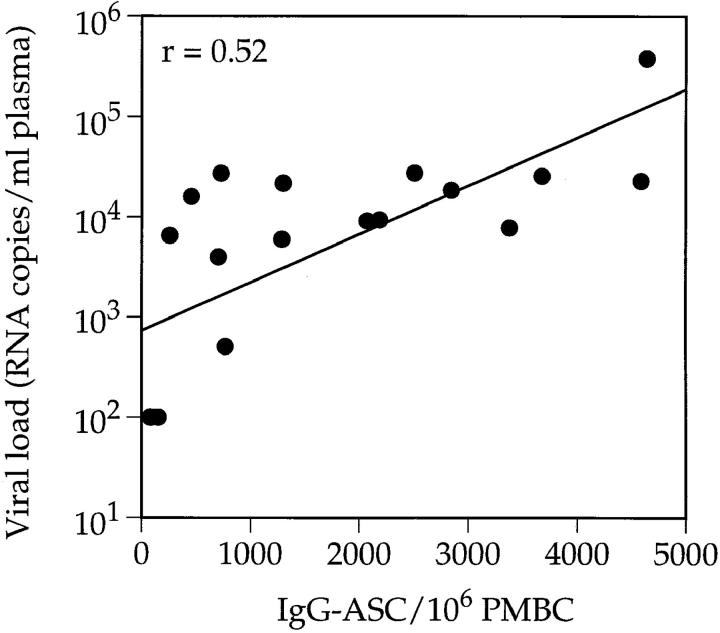
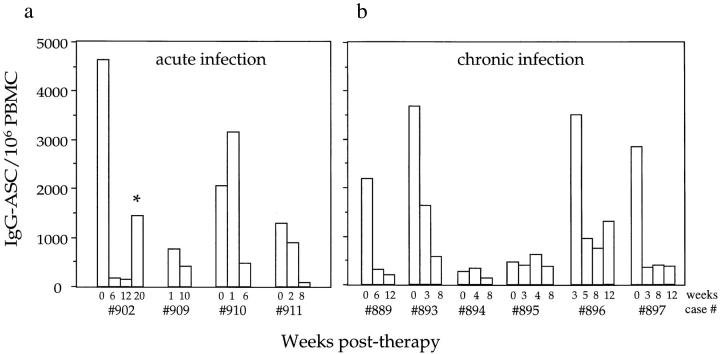
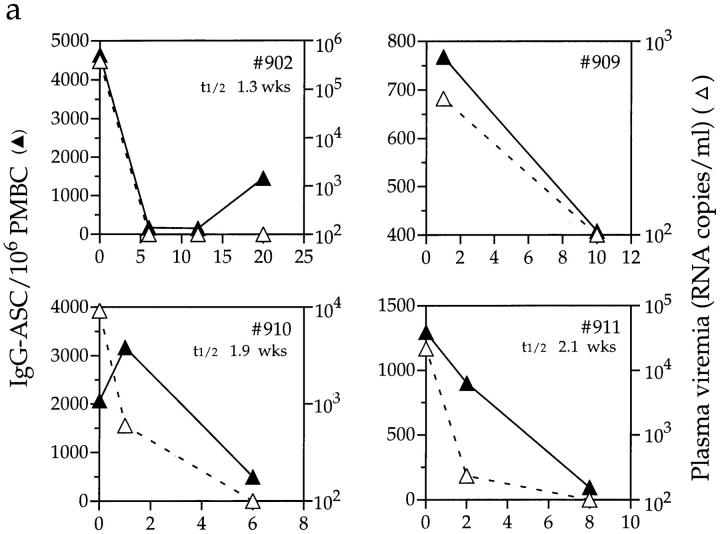
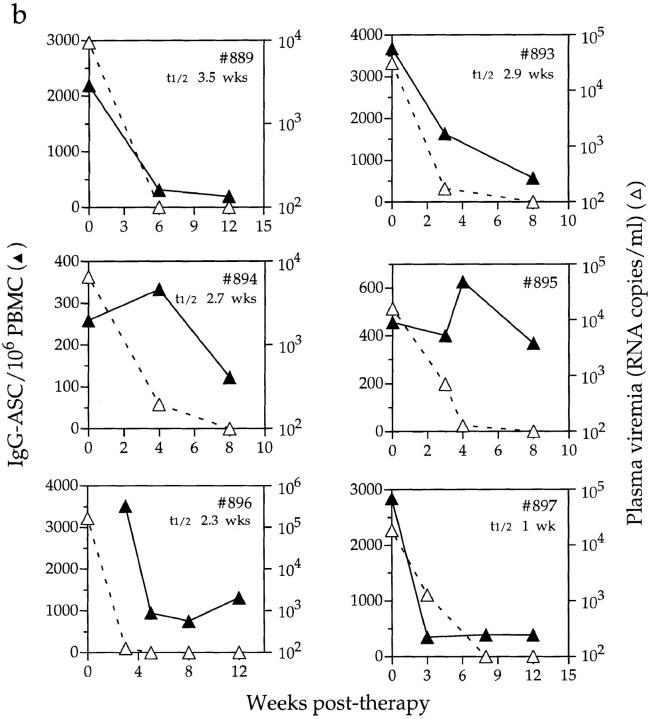
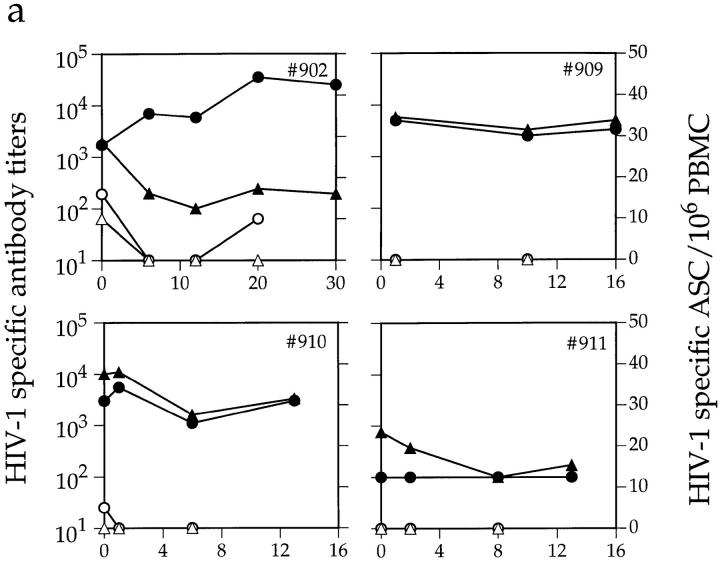
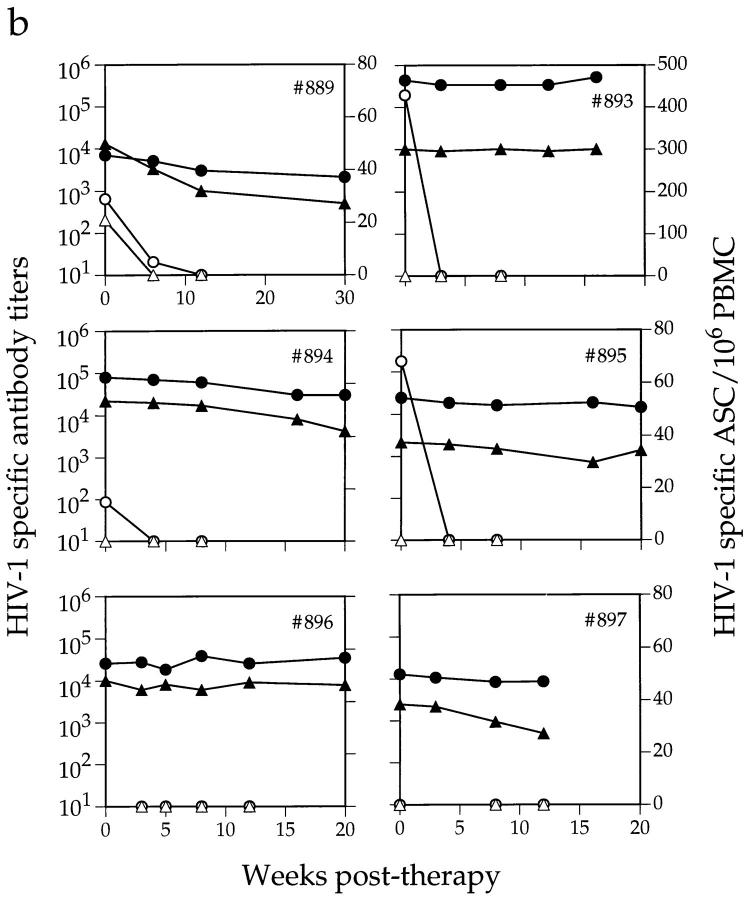
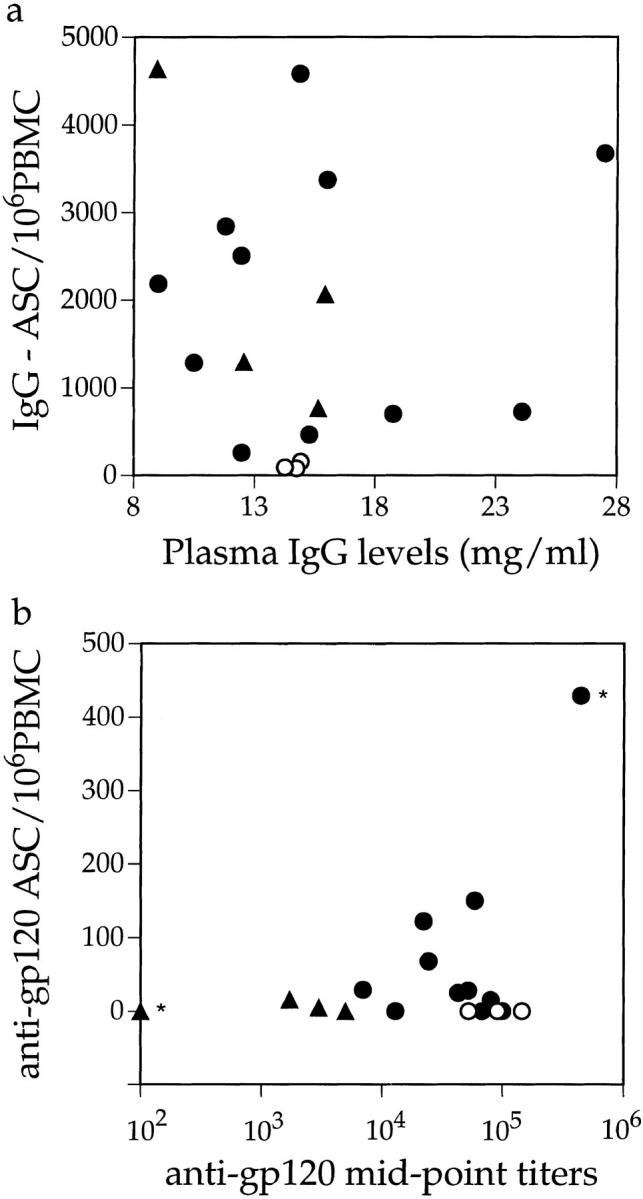
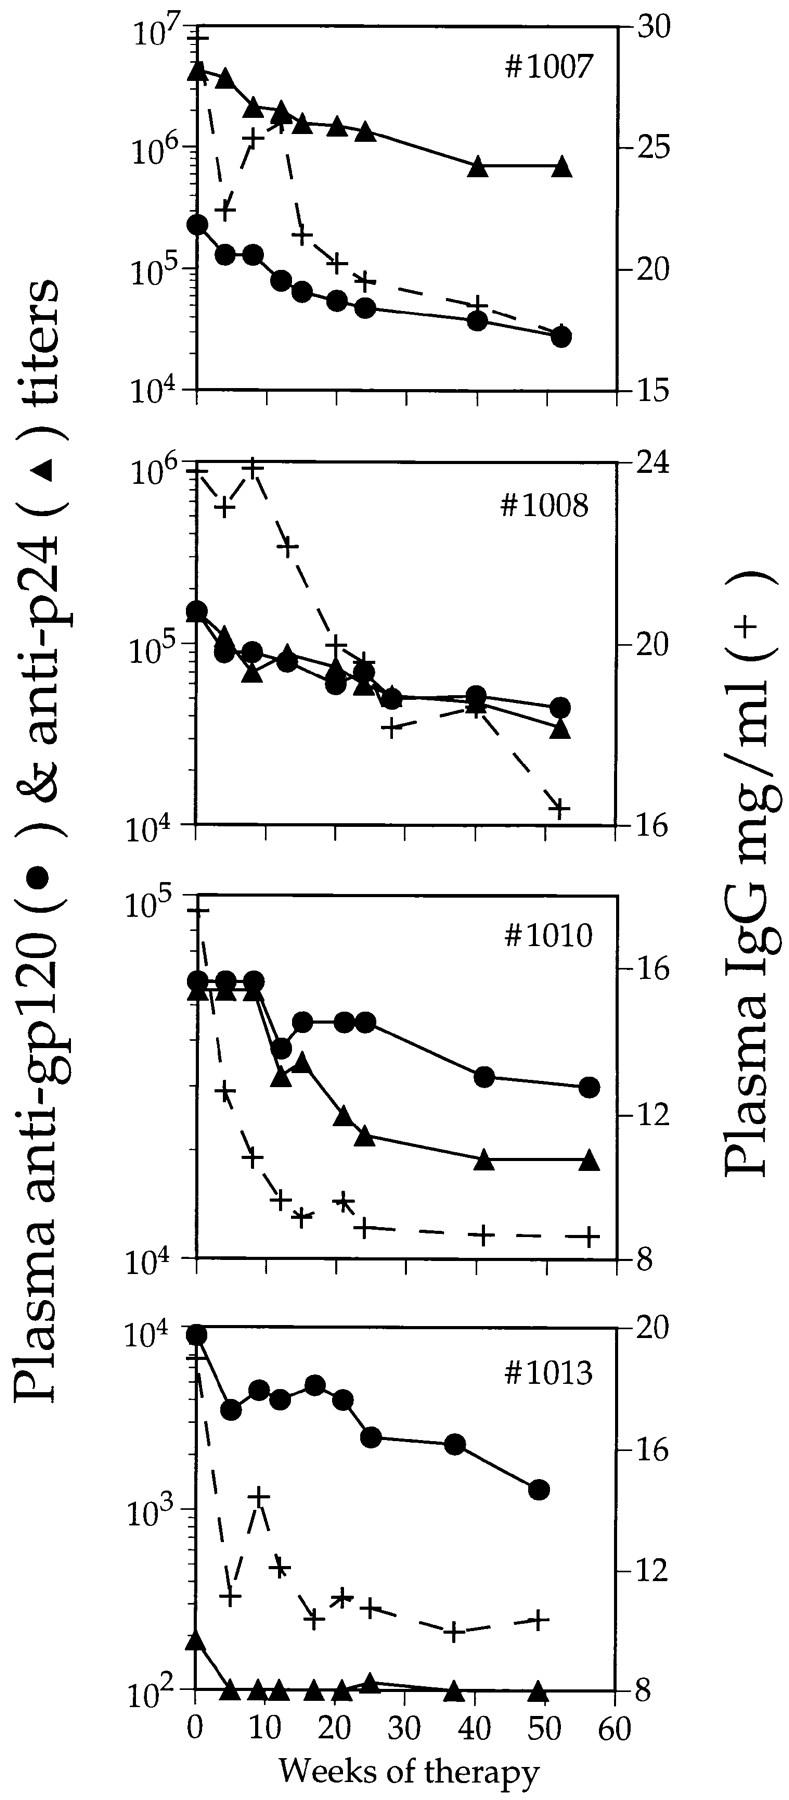
We studied how combination antiviral therapy affects B cell abnormalities associated with HIV-1 infection, namely elevated circulating immunoglobulin (Ig)G antibody-secreting cell (ASC) frequencies and hypergammaglobulinemia. Within a few weeks of starting antiviral therapy, there is a marked decline in IgG-ASC frequency in both acutely and chronically infected people, whereas the hypergammaglobulinemia often present during chronic infection is more gradually resolved. These reductions are sustained while HIV-1 replication is suppressed. HIV-1 antigen-specific B cell responses are also affected by therapy, manifested by a rapid decline in circulating gp120-specific ASCs. Anti-gp120 titers slowly decrease in chronically infected individuals and usually fail to mature in acutely infected individuals who were promptly treated with antiretroviral therapy. Long-term nonprogressors have high titer antibody responses to HIV-1 antigens, but no detectable gp120-specific IgG-ASC, and normal (or subnormal) levels of total circulating IgG-ASC. Overall, we conclude that HIV-1 infection drives B cell hyperactivity, and that this polyclonal activation is rapidly responsive to decreases in viral replication caused by combination antiviral therapy.
Figures
Similar articles
-
Virus-specific antibody production and polyclonal B-cell activation in the intestinal mucosa of HIV-infected individuals.AIDS. 1995 Jul;9(7):695-700. doi: 10.1097/00002030-199507000-00005. AIDS. 1995. PMID: 7546413
-
Potent antiretroviral therapy initiates normalization of hypergammaglobulinemia and a decline in HIV type 1-specific antibody responses.AIDS Res Hum Retroviruses. 2001 Jul 20;17(11):1003-8. doi: 10.1089/088922201300343681. AIDS Res Hum Retroviruses. 2001. PMID: 11485617
-
Human immunodeficiency virus (HIV) type 1 strain MN neutralizing antibody in HIV-infected children: correlation with clinical status and prognostic value.J Infect Dis. 1993 Mar;167(3):538-46. doi: 10.1093/infdis/167.3.538. J Infect Dis. 1993. PMID: 7680059
-
B cell immunopathology during HIV-1 infection: lessons to learn for HIV-1 vaccine design.Vaccine. 2008 Jun 6;26(24):3016-25. doi: 10.1016/j.vaccine.2007.11.063. Epub 2007 Dec 17. Vaccine. 2008. PMID: 18164520 Review.
-
Clonal patterns in the human immune response to HIV-1 infection.Int Rev Immunol. 1992;9(1):1-13. doi: 10.3109/08830189209061779. Int Rev Immunol. 1992. PMID: 1484266 Review. No abstract available.
Cited by
-
Characterization of plasmablasts in the blood of HIV-infected viremic individuals: evidence for nonspecific immune activation.J Virol. 2013 May;87(10):5800-11. doi: 10.1128/JVI.00094-13. Epub 2013 Mar 13. J Virol. 2013. PMID: 23487459 Free PMC article.
-
The intraspleen huPBL NOD/SCID model to study the human HIV-specific antibody response selected in the course of natural infection.J Immunol Methods. 2007 Mar 30;320(1-2):49-57. doi: 10.1016/j.jim.2006.12.003. Epub 2007 Jan 9. J Immunol Methods. 2007. PMID: 17258763 Free PMC article.
-
HIV-1-specific immune responses in subjects who temporarily contain virus replication after discontinuation of highly active antiretroviral therapy.J Clin Invest. 1999 Sep;104(6):R13-8. doi: 10.1172/JCI7371. J Clin Invest. 1999. PMID: 10491418 Free PMC article.
-
Performance of the OraQuick rapid antibody test for diagnosis of human immunodeficiency virus type 1 infection in patients with various levels of exposure to highly active antiretroviral therapy.J Clin Microbiol. 2003 May;41(5):2153-5. doi: 10.1128/JCM.41.5.2153-2155.2003. J Clin Microbiol. 2003. PMID: 12734265 Free PMC article.
-
Noninfectious X4 but not R5 human immunodeficiency virus type 1 virions inhibit humoral immune responses in human lymphoid tissue ex vivo.J Virol. 2004 Jul;78(13):7061-8. doi: 10.1128/JVI.78.13.7061-7068.2004. J Virol. 2004. PMID: 15194782 Free PMC article.
References
-
- Lane HC, Masur H, Edgar LC, Whalen G, Rook AH, Fauci AS. Abnormalities of B-cell activation and immunoregulation in patients with the acquired immunodeficiency syndrome. N Engl J Med. 1983;309:453–458. - PubMed
-
- Amadori A, DeRossi A, Faulkner-Valle GP, Chieco-Bianchi L. Spontaneous in vitro production of virus-specific antibody by lymphocytes from HIV infected subjects. Clin Immunol Immunopathol. 1988;46:342–351. - PubMed
-
- Amadori A, Zamarch R, Ciminale V, Del Mistro A, Siervo S, Alberti A, Colombatti M, Chieco-Bianchi L. HIV-1 specific B cell activation. A major constituent of spontaneous B cell activation during HIV-1 infection. J Immunol. 1989;143:2146–2152. - PubMed
Publication types
MeSH terms
Substances
Grants and funding
LinkOut - more resources
Full Text Sources
Other Literature Sources
Medical
Miscellaneous
