. 1998 Jul 13;142(1):295-305.
doi: 10.1083/jcb.142.1.295.

Differential roles for bone morphogenetic protein (BMP) receptor type IB and IA in differentiation and specification of mesenchymal precursor cells to osteoblast and adipocyte lineages

Affiliations

Differential roles for bone morphogenetic protein (BMP) receptor type IB and IA in differentiation and specification of mesenchymal precursor cells to osteoblast and adipocyte lineages

D Chen et al. J Cell Biol. .

Abstract

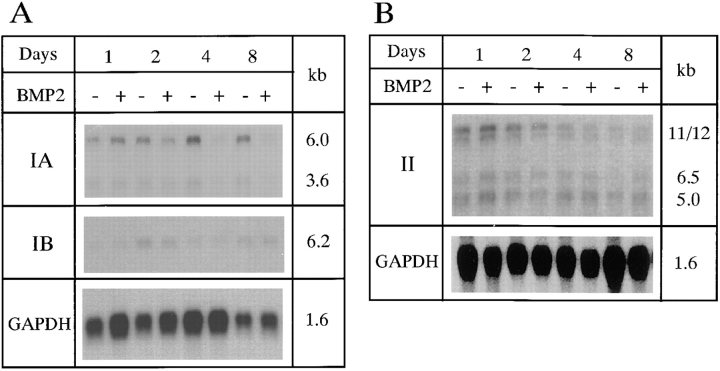
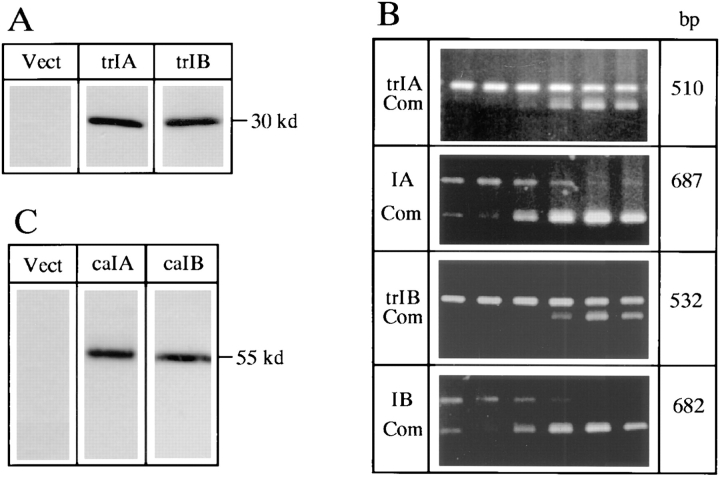
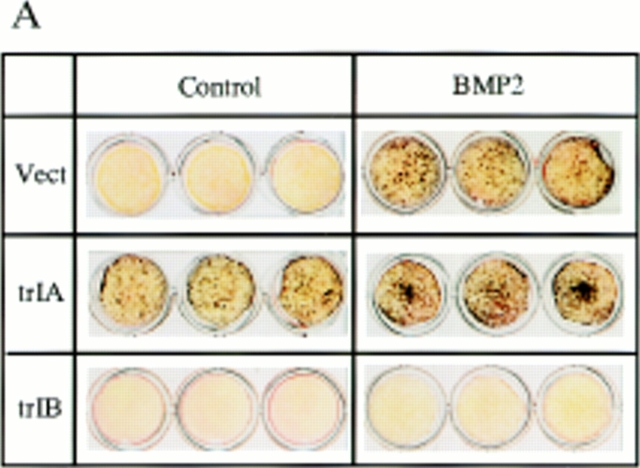
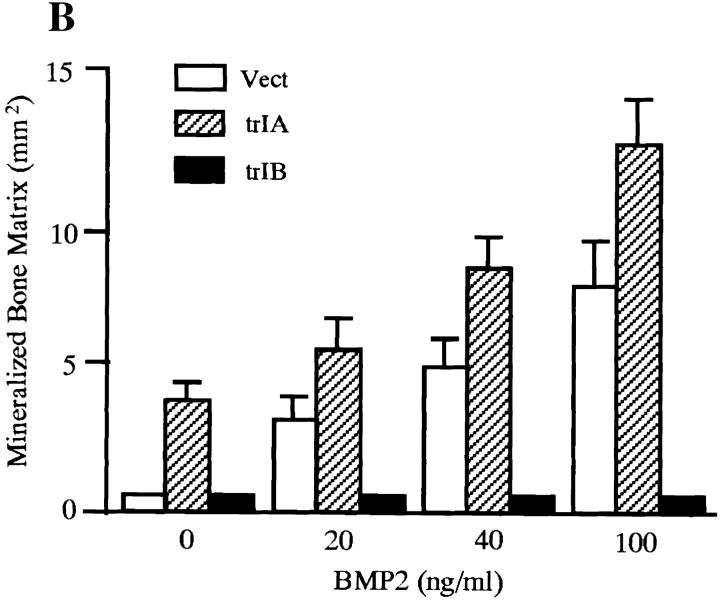
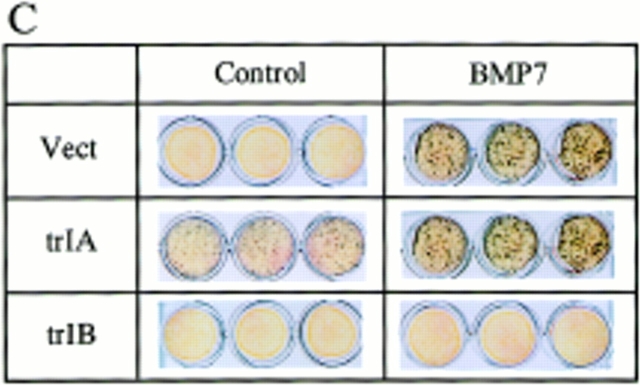
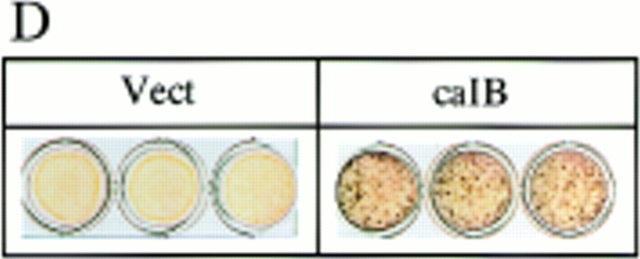
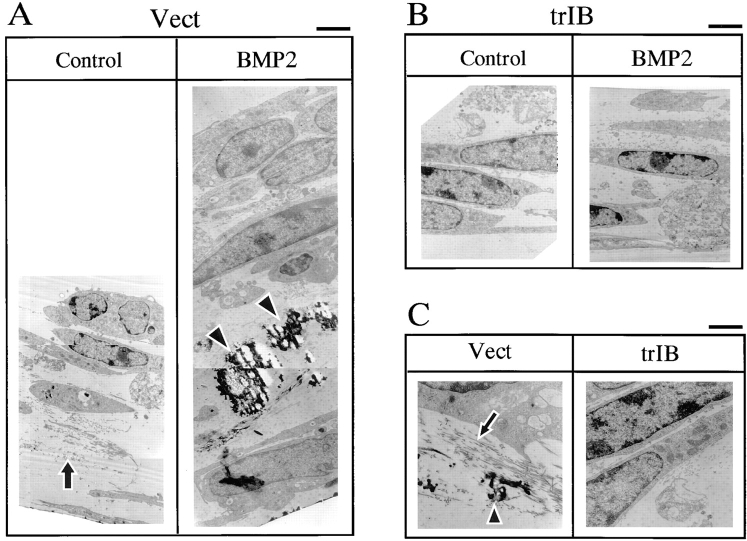
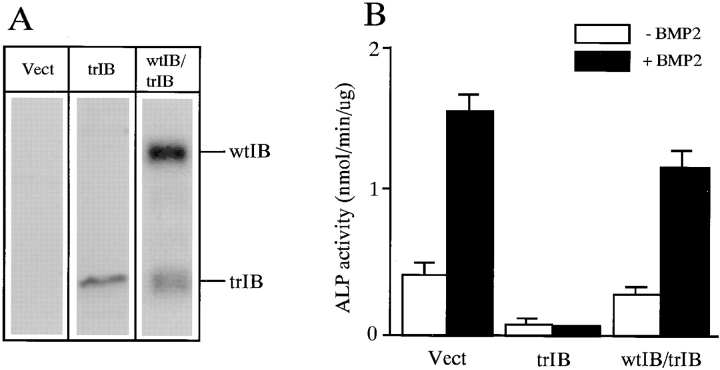
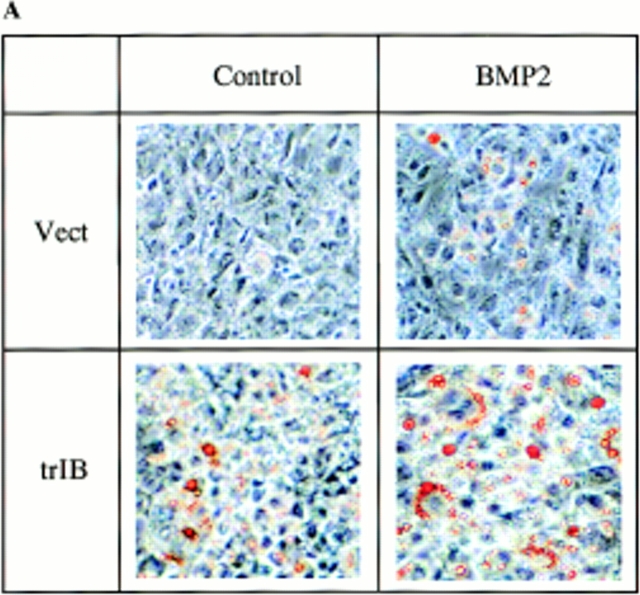
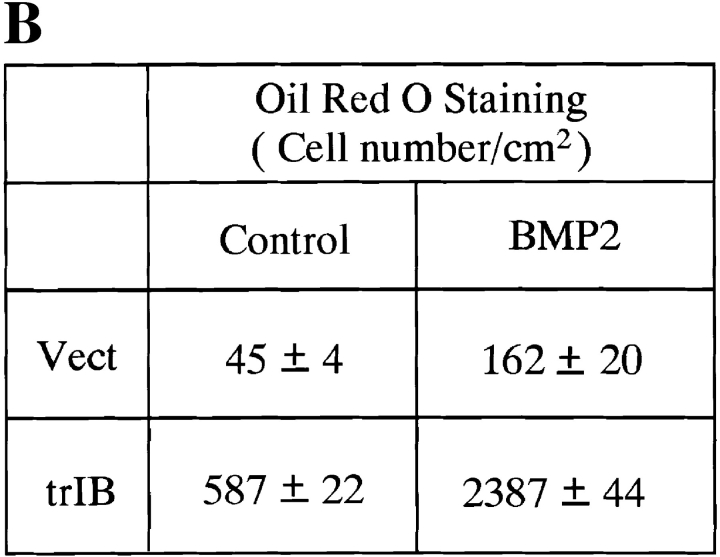
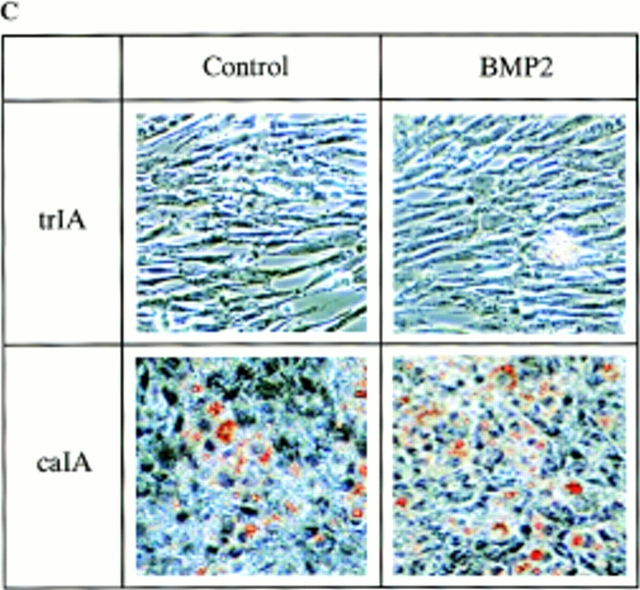
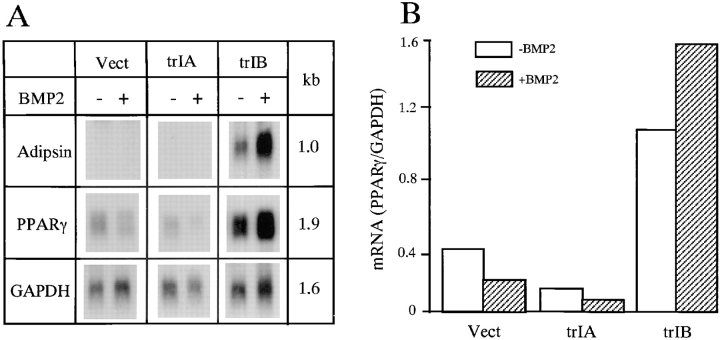
Cumulative evidence indicates that osteoblasts and adipocytes share a common mesenchymal precursor and that bone morphogenetic proteins (BMPs) can induce both osteoblast and adipocyte differentiation of this precursor. In the present study, we investigated the roles of BMP receptors in differentiation along these separate lineages using a well-characterized clonal cell line, 2T3, derived from the mouse calvariae. BMP-2 induced 2T3 cells to differentiate into mature osteoblasts or adipocytes depending upon culture conditions. To test the specific roles of the type IA and IB BMP receptor components, truncated and constitutively active type IA and IB BMP receptor cDNAs were stably expressed in these cells. Overexpression of truncated type IB BMP receptor (trBMPR-IB) in 2T3 cells completely blocked BMP-2-induced osteoblast differentiation and mineralized bone matrix formation. Expression of trBMPR-IB also blocked mRNA expression of the osteoblast specific transcription factor, Osf2/ Cbfa1, and the osteoblast differentiation-related genes, alkaline phosphatase (ALP) and osteocalcin (OC). BMP-2-induced ALP activity could be rescued by transfection of wild-type (wt) BMPR-IB into 2T3 clones containing trBMPR-IB. Expression of a constitutively active BMPR-IB (caBMPR-IB) induced formation of mineralized bone matrix by 2T3 cells without addition of BMP-2. In contrast, overexpression of trBMPR-IA blocked adipocyte differentiation and expression of caBMPR-IA induced adipocyte formation in 2T3 cells. Expression of the adipocyte differentiation-related genes, adipsin and PPARgamma, correlated with the distinct phenotypic changes found after overexpression of the appropriate mutant receptors. These results demonstrate that type IB and IA BMP receptors transmit different signals to bone-derived mesenchymal progenitors and play critical roles in both the specification and differentiation of osteoblasts and adipocytes.


Figures

Figure 1
Figure 1
Type IA, IB, and type II BMP receptor mRNA expression in 2T3 cells. 2T3 cells were cultured under conditions in which mineralized bone matrix forms. Day 0 is defined as the day the cells reach confluence and the medium is changed to αMEM supplemented with 5% FCS, 100 μg/ml ascorbic acid, and 5 mM β-glycerol phosphate with or without 40 ng/ml of BMP-2. (A) Two transcripts (3.6 and 6.0 kb) of BMPR-IA, one transcript (6.2 kb) of BMPR-IB, and (B) four transcripts (5.0, 6.5, 11, and 12 kb) of BMPR-II were detected in 2T3 cells.
Figure 2
Figure 2
Expression of truncated type IA and IB and constitutively active type IA and IB BMP receptors in 2T3 cells. (A) Expression of trBMPR-IA (trIA) and trBMPR-IB (trIB) protein (∼30 kD) in 2T3 cells was detected by Western analysis using anti-HA antibody. (B) Quantitation of expression levels of the truncated and endogenous BMPR-IA (trIA and IA) and BMPR-IB (trIB and IB) transcripts in 2T3 clones expressing trBMPR-IA and trBMPR-IB. The generation of a competitor and RT-PCR conditions were described in Materials and Methods. Increasing concentrations of DNA competitor (Com) at concentrations of 0.001, 0.01, 0.1, 1, 10, and 100 fmol (left to right) were added to each PCR reaction. The intensity of PCR products was quantitated by an AMBIS image acquisition system. (C) Expression of caBMPR-IA (caIA) and caBMPR-IB (caIB) protein (∼55 kD) in 2T3 cells was detected by Western analysis using anti-HA antibody.
Figure 3
Figure 3
Von Kossa stain of 2T3 clones containing the empty vector, trBMPR-IA, trBMPR-IB and caBMPR-IB. (A) Effects of overexpression of trBMPR-IA (trIA) and trBMPR-IB (trIB) on BMP-2–induced mineralized bone matrix formation. The cells were cultured for 12 d in the presence or absence of 100 ng/ml of BMP-2. After incubation, the cells were fixed with 10% formalin and stained by von Kossa method. (B) The mineralized bone matrix formation of 2T3 cells containing the empty vector (Vect); trIA and trIB were quantitated by computer image analyzer. The data represent the mean ± SE for three samples. (C) Effects of overexpression of trBMPR-IA (trIA) and trBMPR-IB (trIB) on BMP-7– induced mineralized bone matrix formation. The cells were cultured for 12 d in the presence or absence of 200 ng/ml of BMP-7. (D) Effects of overexpression of caBMPR-IB (caIB) on mineralized bone matrix formation. The cells were cultured for 12 d and stained by von Kossa method.
Figure 3
Figure 3
Von Kossa stain of 2T3 clones containing the empty vector, trBMPR-IA, trBMPR-IB and caBMPR-IB. (A) Effects of overexpression of trBMPR-IA (trIA) and trBMPR-IB (trIB) on BMP-2–induced mineralized bone matrix formation. The cells were cultured for 12 d in the presence or absence of 100 ng/ml of BMP-2. After incubation, the cells were fixed with 10% formalin and stained by von Kossa method. (B) The mineralized bone matrix formation of 2T3 cells containing the empty vector (Vect); trIA and trIB were quantitated by computer image analyzer. The data represent the mean ± SE for three samples. (C) Effects of overexpression of trBMPR-IA (trIA) and trBMPR-IB (trIB) on BMP-7– induced mineralized bone matrix formation. The cells were cultured for 12 d in the presence or absence of 200 ng/ml of BMP-7. (D) Effects of overexpression of caBMPR-IB (caIB) on mineralized bone matrix formation. The cells were cultured for 12 d and stained by von Kossa method.
Figure 4
Figure 4
Transmission electron microscopic analysis of the mineralized bone matrix structure of 2T3 cells. (A and B) Empty vector control (Vect) and trBMPR-IB (trIB)–expressing 2T3 clones were cultured for 12 d in the presence or absence of 100 ng/ml of BMP-2 and fixed with Na cacodylate and glutaraldehyde buffer for electron microscopy analysis. (C) High magnification of collagen fibers and mineralized bone matrix of 2T3 cells containing the empty vector (Vect) and trBMPR-IB (trIB). Arrows, unmineralized collagen fibers; arrowheads, mature mineralized matrix. Bars: (A and B) 2 μm; (C) 1 μm.
Figure 5
Figure 5
Osf2/Cbfa1, alkaline phosphatase (ALP) and osteocalcin (OC) mRNA expression in 2T3 cells. 2T3 cells containing the empty vector (Vect) or trBMPR-IB (trIB) were cultured for 8 d in αMEM containing 5% FCS, 100 μg/ml ascorbic acid, and 5 mM β-glycerol phosphate with or without 40 ng/ml of BMP-2. (A and B) The Osf2/Cbfa1 (6.0 kb), ALP (3.0 kb), and OC (0.5 kb) mRNA expression was detected by Northern analysis.
Figure 6
Figure 6
Effects of BMP-2 on ALP activity in 2T3 cells. 2T3 clones expressing trBMPR-IB was transiently transfected with wtBMPR-IB. (A) Expression of wtBMPR-IB (wtIB) and trBMPR-IB (trIB) in 2T3 clones expressing trBMPR-IB was detected by Western analysis. (B) ALP activity and BMP-2 (100 ng/ml) response was assayed in control, trBMPR-IB and wtBMPR-IB/ trBMPR-IB clones. The unit of ALP activity is nanomoles of p-nitrophenol formed per microgram of protein per minute. Data are the mean ± SE for three samples.
Figure 7
Figure 7
Adipocyte formation in 2T3 cells containing different mutant BMP receptors. (A) 2T3 cells containing the empty vector (Vect) and trBMPR-IB (trIB) were cultured for 8 d in αMEM containing 5% rabbit serum, 0.5 mM IBMX, and 60 mM indomethacin in the presence or absence of 100 ng/ml of BMP-2. After incubation, the cells were fixed with 10% formalin and stained with 0.2% Oil red O solution. (B) Oil red O–positive staining adipocytes in control and trBMPR-IB–expressing clones were quantitated using a phase-contrast microscope. The data represents the mean ± SE for three samples. (C) Adipocyte formation in 2T3 cells expressing trBMPR-IA (trIA) and caBMPR-IA (caIA) in the presence or absence of 100 ng/ml of BMP-2. After 8 d of incubation, the cells were stained by the Oil red O staining method.
Figure 7
Figure 7
Adipocyte formation in 2T3 cells containing different mutant BMP receptors. (A) 2T3 cells containing the empty vector (Vect) and trBMPR-IB (trIB) were cultured for 8 d in αMEM containing 5% rabbit serum, 0.5 mM IBMX, and 60 mM indomethacin in the presence or absence of 100 ng/ml of BMP-2. After incubation, the cells were fixed with 10% formalin and stained with 0.2% Oil red O solution. (B) Oil red O–positive staining adipocytes in control and trBMPR-IB–expressing clones were quantitated using a phase-contrast microscope. The data represents the mean ± SE for three samples. (C) Adipocyte formation in 2T3 cells expressing trBMPR-IA (trIA) and caBMPR-IA (caIA) in the presence or absence of 100 ng/ml of BMP-2. After 8 d of incubation, the cells were stained by the Oil red O staining method.
Figure 8
Figure 8
Adipocyte marker gene expression in 2T3 cells. 2T3 cells containing the empty vector (Vect), trBMPR-IA (trIA), and trBMPR-IB (trIB) were cultured for 8 d in αMEM containing 5% rabbit serum, 0.5 mM IBMX, and 60 mM of indomethacin with or without 40 ng/ml of BMP-2. (A) Adipsin (1.0 kb) and PPARγ (1.9 kb) mRNA expression were detected by Northern analysis. (B) The levels of PPARγ mRNA expression was quantitated and normalized to GAPDH levels.

Similar articles

Cited by

References

    1. Ahrens M, Ankenbauer T, Schroder D, Hollnagel A, Mayer H, Gross G. Expression of human bone morphogenetic protein-2 or -4 in murine mesenchymal progenitor C3H10T1/2 cells induces differentiation into distinct mesenchymal cell lineages. DNA Cell Biol. 1993;12:871–880. - PubMed
    1. Asahina I, Sampath TK, Hauschka PV. Human osteogenic protein-1 induces chondroblastics, osteoblastics and/or adipocyte differentiation of clonal murine target cells. Exp Cell Res. 1996;222:38–47. - PubMed
    1. Aubin JE, Liu F, Malaval L, Gupta AK. Osteoblast and chondroblast differentiation. Bone. 1995;17:77S–83S. - PubMed
    1. Bennett JH, Joyner CJ, Triffitt JT, Owen ME. Adipocytic cells cultured from marrow have osteogenic potential. J Cell Sci. 1991;99:131–139. - PubMed
    1. Beresford JN, Bennett JH, Delving C, Leboy PS, Owen ME. Evidence for an inverse relationship between the differentiation of adipocytic and osteogenic cells in rat marrow stromal cell cultures. J Cell Sci. 1992;102:341–351. - PubMed

Publication types

MeSH terms