

Targeted disruption of the gene encoding hepatocyte nuclear factor 3gamma results in reduced transcription of hepatocyte-specific genes
- PMID: 9632808
- PMCID: PMC109008
- DOI: 10.1128/MCB.18.7.4245
Targeted disruption of the gene encoding hepatocyte nuclear factor 3gamma results in reduced transcription of hepatocyte-specific genes
Abstract
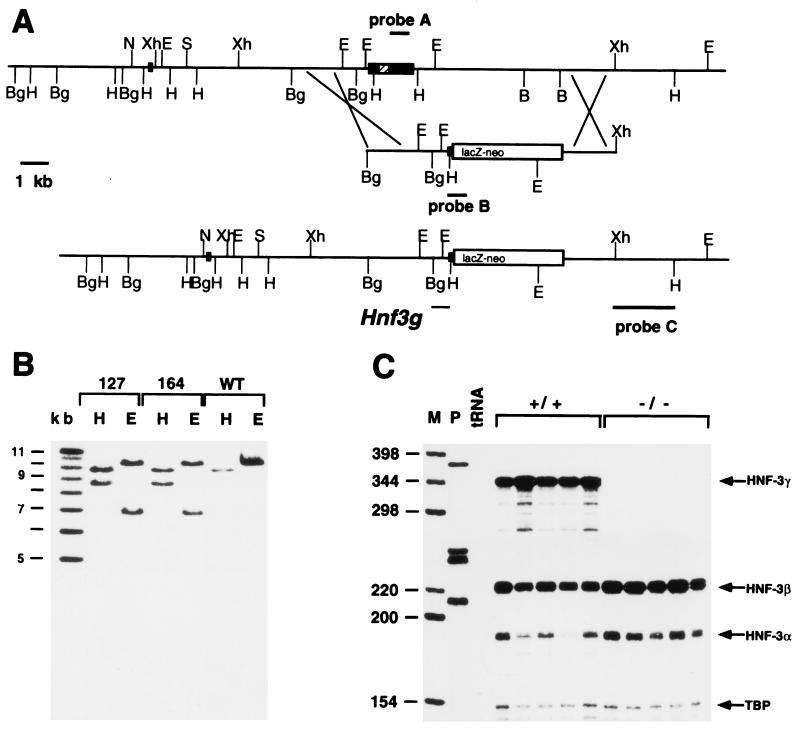
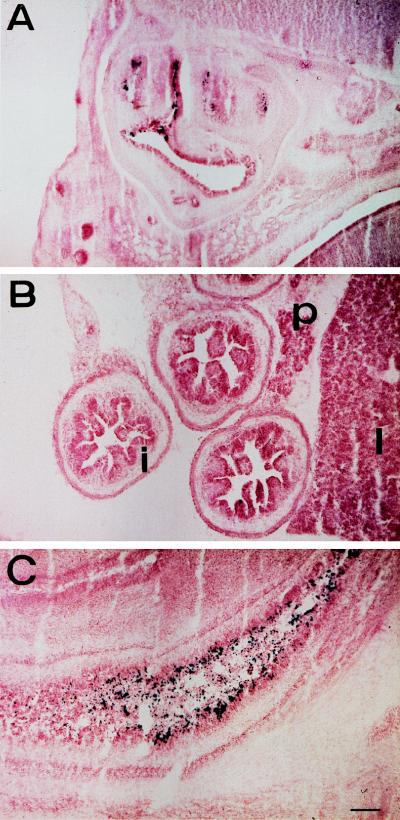
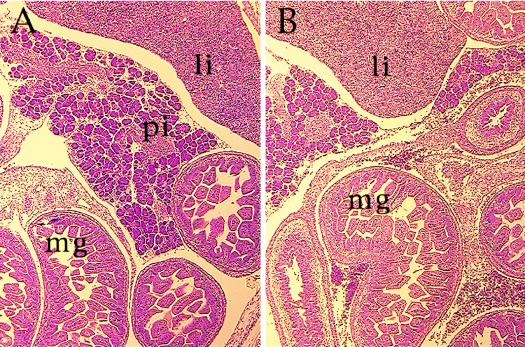
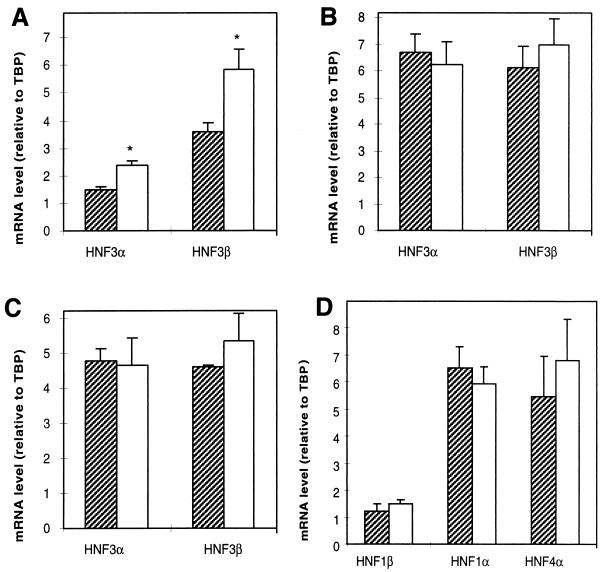
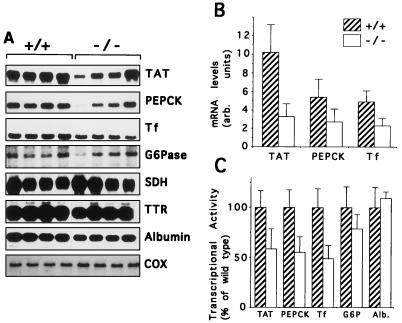
The winged helix transcription factor hepatocyte nuclear factor 3gamma (HNF3gamma) is expressed in embryonic endoderm and its derivatives liver, pancreas, stomach, and intestine, as well as in testis and ovary. We have generated mice carrying an Hnf3g-lacZ fusion which deletes most of the HNF3gamma coding sequence as well as 5.5 kb of 3' flanking region. Mice homozygous for the mutation are fertile, develop normally, and show no morphological defects. The mild phenotype change of the Hnf3g-/- mice can be explained in part by an upregulation of HNF3alpha and HNF3beta in the liver of the mutant animals. Analysis of steady-state mRNA levels as well as transcription rates showed that levels of expression of several HNF3 target genes (phosphoenolpyruvate carboxykinase, transferrin, tyrosine aminotransferase) were reduced by 50 to 70%, indicating that HNF3gamma is an important activator of these genes in vivo.
Figures
Similar articles
-
Transcriptional regulation in endoderm development: characterization of an enhancer controlling Hnf3g expression by transgenesis and targeted mutagenesis.EMBO J. 1997 Jul 1;16(13):3995-4006. doi: 10.1093/emboj/16.13.3995. EMBO J. 1997. PMID: 9233809 Free PMC article.
-
Growth hormone regulates the expression of hepatocyte nuclear factor-3 gamma and other liver-enriched transcription factors in the bovine liver.J Endocrinol. 2005 Jan;184(1):95-105. doi: 10.1677/joe.1.05821. J Endocrinol. 2005. PMID: 15642787
-
Elevated levels of hepatocyte nuclear factor 3beta in mouse hepatocytes influence expression of genes involved in bile acid and glucose homeostasis.Mol Cell Biol. 2000 Nov;20(21):8264-82. doi: 10.1128/MCB.20.21.8264-8282.2000. Mol Cell Biol. 2000. PMID: 11027295 Free PMC article.
-
The hepatocyte nuclear factor 3 (HNF3 or FOXA) family in metabolism.Trends Endocrinol Metab. 2000 Sep;11(7):281-5. doi: 10.1016/s1043-2760(00)00271-x. Trends Endocrinol Metab. 2000. PMID: 10920385 Review.
-
Transcriptional activators in hepatocytes.Cell Growth Differ. 1990 Jan;1(1):47-52. Cell Growth Differ. 1990. PMID: 2078499 Review. No abstract available.
Cited by
-
Transcription Control of Liver Development.Cells. 2021 Aug 8;10(8):2026. doi: 10.3390/cells10082026. Cells. 2021. PMID: 34440795 Free PMC article. Review.
-
FoxA family members are crucial regulators of the hypertrophic chondrocyte differentiation program.Dev Cell. 2012 May 15;22(5):927-39. doi: 10.1016/j.devcel.2012.03.011. Dev Cell. 2012. PMID: 22595668 Free PMC article.
-
Distinct roles of FOXA2 and FOXA3 in allergic airway disease and asthma.Am J Respir Crit Care Med. 2009 Oct 1;180(7):603-10. doi: 10.1164/rccm.200811-1768OC. Epub 2009 Jul 23. Am J Respir Crit Care Med. 2009. PMID: 19628779 Free PMC article.
-
Impaired glucose homeostasis and neonatal mortality in hepatocyte nuclear factor 3alpha-deficient mice.Proc Natl Acad Sci U S A. 1999 Aug 31;96(18):10152-7. doi: 10.1073/pnas.96.18.10152. Proc Natl Acad Sci U S A. 1999. PMID: 10468578 Free PMC article.
-
Insulin's expanding control of forkheads.Proc Natl Acad Sci U S A. 2003 Sep 30;100(20):11198-200. doi: 10.1073/pnas.2135308100. Epub 2003 Sep 23. Proc Natl Acad Sci U S A. 2003. PMID: 14506300 Free PMC article. No abstract available.
References
-
- Ang S L, Rossant J. HNF-3 beta is essential for node and notochord formation in mouse development. Cell. 1994;78:561–574. - PubMed
-
- Ang S L, Wierda A, Wong D, Stevens K A, Cascio S, Rossant J, Zaret K S. The formation and maintenance of the definitive endoderm lineage in the mouse: involvement of HNF3/forkhead proteins. Development. 1993;119:1301–1315. - PubMed
-
- Ausubel F M, Brent R, Kingston R E, Moore D D, Seidman J G, Smith J A, Struhl K. Current protocols in molecular biology. New York, N.Y: John Wiley and Sons; 1995.
-
- Cereghini S. Liver-enriched transcription factors and hepatocyte differentiation. FASEB J. 1996;10:267–282. - PubMed
Publication types
MeSH terms
Substances
Grants and funding
LinkOut - more resources
Full Text Sources
Other Literature Sources
Molecular Biology Databases