Production of mice deficient in genes for interleukin (IL)-1alpha, IL-1beta, IL-1alpha/beta, and IL-1 receptor antagonist shows that IL-1beta is crucial in turpentine-induced fever development and glucocorticoid secretion
- PMID: 9565638
- PMCID: PMC2212263
- DOI: 10.1084/jem.187.9.1463
Production of mice deficient in genes for interleukin (IL)-1alpha, IL-1beta, IL-1alpha/beta, and IL-1 receptor antagonist shows that IL-1beta is crucial in turpentine-induced fever development and glucocorticoid secretion
Abstract
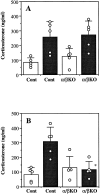
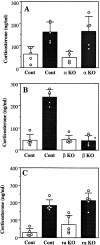
Interleukin (IL)-1 is a major mediator of inflammation and exerts pleiotropic effects on the neuro-immuno-endocrine system. To elucidate pathophysiological roles of IL-1, we have first produced IL-1alpha/beta doubly deficient (KO) mice together with mice deficient in either the IL-1alpha, IL-1beta, or IL-1 receptor antagonist (IL-1ra) genes. These mice were born healthy, and their growth was normal except for IL-1ra KO mice, which showed growth retardation after weaning. Fever development upon injection with turpentine was suppressed in IL-1beta as well as IL-1alpha/beta KO mice, but not in IL-1alpha KO mice, whereas IL-1ra KO mice showed an elevated response. At this time, expression of IL-1beta mRNA in the diencephalon decreased 1.5-fold in IL-1alpha KO mice, whereas expression of IL-1alpha mRNA decreased >30-fold in IL-1beta KO mice, suggesting mutual induction between IL-1alpha and IL-1beta. This mutual induction was also suggested in peritoneal macrophages stimulated with lipopolysaccharide in vitro. In IL-1beta KO mice treated with turpentine, the induction of cyclooxygenase-2 (EC 1.14.99.1) in the diencephalon was suppressed, whereas it was enhanced in IL-1ra KO mice. We also found that glucocorticoid induction 8 h after turpentine treatment was suppressed in IL-1beta but not IL-1alpha KO mice. These observations suggest that IL-1beta but not IL-1alpha is crucial in febrile and neuro-immuno-endocrine responses, and that this is because IL-1alpha expression in the brain is dependent on IL-1beta. The importance of IL-1ra both in normal physiology and under stress is also suggested.
Figures




Similar articles
-
IL-6 and IL-1 beta in fever. Studies using cytokine-deficient (knockout) mice.Ann N Y Acad Sci. 1998 Sep 29;856:33-47. doi: 10.1111/j.1749-6632.1998.tb08310.x. Ann N Y Acad Sci. 1998. PMID: 9917862
-
Role of endogenous interleukin-1 receptor antagonist in regulating fever induced by localised inflammation in the rat.J Physiol. 2001 Feb 15;531(Pt 1):171-80. doi: 10.1111/j.1469-7793.2001.0171j.x. J Physiol. 2001. PMID: 11179401 Free PMC article.
-
Hyperresponsive febrile reactions to interleukin (IL) 1alpha and IL-1beta, and altered brain cytokine mRNA and serum cytokine levels, in IL-1beta-deficient mice.Proc Natl Acad Sci U S A. 1997 Mar 18;94(6):2681-6. doi: 10.1073/pnas.94.6.2681. Proc Natl Acad Sci U S A. 1997. PMID: 9122256 Free PMC article.
-
The inflammatory response in interleukin-1 beta-deficient mice: comparison with other cytokine-related knock-out mice.J Leukoc Biol. 1996 Apr;59(4):489-93. doi: 10.1002/jlb.59.4.489. J Leukoc Biol. 1996. PMID: 8613694 Review.
-
The interleukin-1 system: receptors, ligands, and ICE in the brain and their involvement in the fever response.Ann N Y Acad Sci. 1998 May 1;840:51-8. doi: 10.1111/j.1749-6632.1998.tb09548.x. Ann N Y Acad Sci. 1998. PMID: 9629236 Review.
Cited by
-
IL-1 Coordinates the Neutrophil Response to C. albicans in the Oral Mucosa.PLoS Pathog. 2016 Sep 15;12(9):e1005882. doi: 10.1371/journal.ppat.1005882. eCollection 2016 Sep. PLoS Pathog. 2016. PMID: 27632536 Free PMC article.
-
Myeloid cell transmigration across the CNS vasculature triggers IL-1β-driven neuroinflammation during autoimmune encephalomyelitis in mice.J Exp Med. 2016 May 30;213(6):929-49. doi: 10.1084/jem.20151437. Epub 2016 May 2. J Exp Med. 2016. PMID: 27139491 Free PMC article.
-
Leukocyte-derived interleukin-1beta interacts with renal interleukin-1 receptor I to promote renal tumor necrosis factor and glomerular injury in murine crescentic glomerulonephritis.Am J Pathol. 2004 Jun;164(6):1967-77. doi: 10.1016/s0002-9440(10)63757-1. Am J Pathol. 2004. PMID: 15161633 Free PMC article.
-
Behavioral and endocrine effects of endotoxin in wild-type mice and mice deficient in interleukin 1: sickness behavior or adaptive response?Dokl Biol Sci. 2001 Jul-Aug;379:322-4. doi: 10.1023/a:1011687810496. Dokl Biol Sci. 2001. PMID: 12918364 No abstract available.
-
Genetic and Pharmacological Disruption of Interleukin-1α Leads to Augmented Murine Aortic Aneurysm.Ann Vasc Surg. 2022 Sep;85:358-370. doi: 10.1016/j.avsg.2022.05.024. Epub 2022 Jun 6. Ann Vasc Surg. 2022. PMID: 35680012 Free PMC article.
References
-
- Dinarello CA. Biologic basis for interleukin-1 in disease. Blood. 1996;87:2095–2147. - PubMed
-
- Durum, S.K., and J.J. Oppenheim. 1993. Proinflammatory cytokines and immunity. In Fundamental Immunology, 3rd ed. W.E. Paul, editor. Raven Press, Ltd., New York. 801– 835.
-
- Tocci, M.J., and J.A. Schmidt. 1997. Interleukin-1: structure and function. In Cytokines in Health and Disease, 2nd ed. D.G. Remick and J.S. Friedland, editors. Marcel Dekker, Inc., New York. 1–27.
-
- Dinarello CA. Interleukin-1 and interleukin-1 antagonism. Blood. 1991;77:1627–1652. - PubMed
-
- Silver ARJ, Masson WK, George AM, Adam J, Cox R. The IL-1α and β genes are closely linked (<70 kb) on mouse chromosome 2. Somatic Cell Mol Genet. 1990;16:549–556. - PubMed
Publication types
MeSH terms
Substances
LinkOut - more resources
Full Text Sources
Other Literature Sources
Medical
Molecular Biology Databases
Research Materials

