

Membrane voltage initiates Ca2+ waves and potentiates Ca2+ increases with abscisic acid in stomatal guard cells
- PMID: 9539815
- PMCID: PMC22567
- DOI: 10.1073/pnas.95.8.4778
Membrane voltage initiates Ca2+ waves and potentiates Ca2+ increases with abscisic acid in stomatal guard cells
Abstract
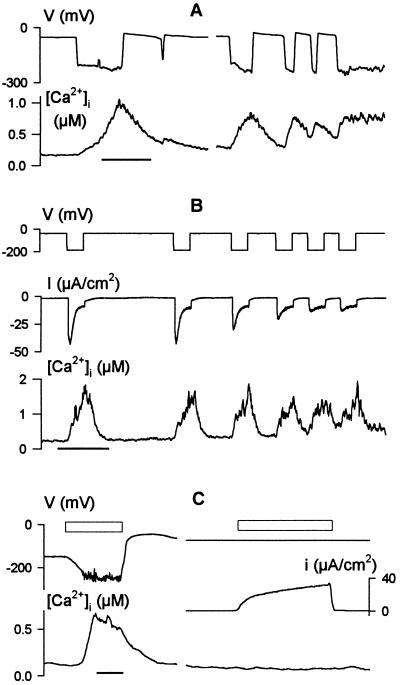
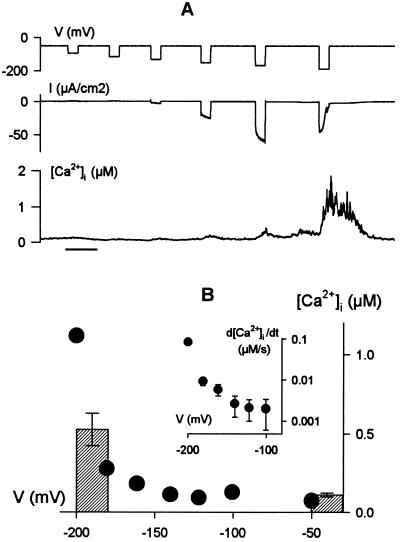
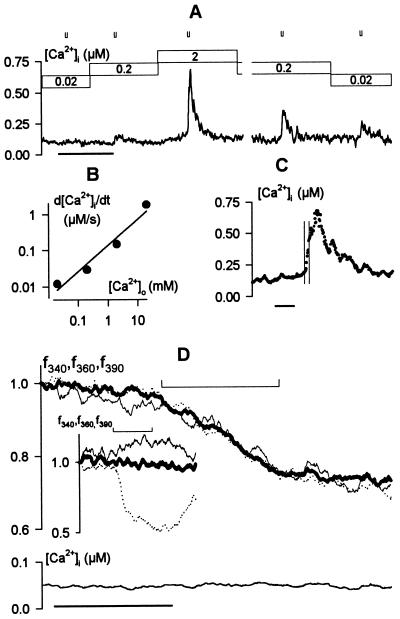
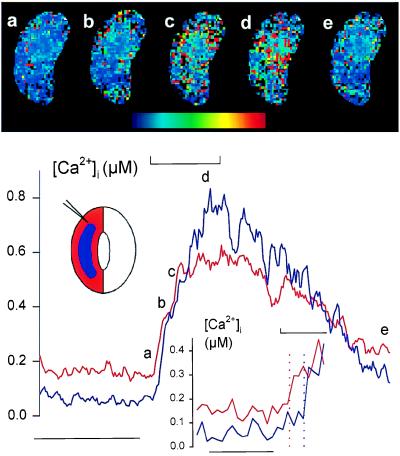
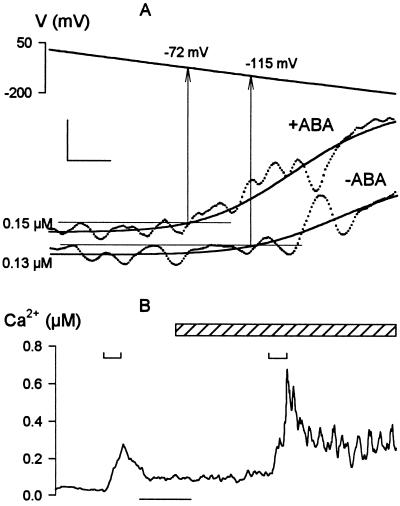
In higher plants changes and oscillations in cytosolic free Ca2+ concentration ([Ca2+]i) are central to hormonal physiology, including that of abscisic acid (ABA), which signals conditions of water stress and alters ion channel activities in guard cells of higher-plant leaves. Such changes in [Ca2+]i are thought to encode for cellular responses to different stimuli, but their origins and functions are poorly understood. Because transients and oscillations in membrane voltage also occur in guard cells and are elicited by hormones, including ABA, we suspected a coupling of [Ca2+]i to voltage and its interaction with ABA. We recorded [Ca2+]i by Fura2 fluorescence ratio imaging and photometry while bringing membrane voltage under experimental control with a two-electrode voltage clamp in intact Vicia guard cells. Free-running oscillations between voltages near -50 mV and -200 mV were associated with oscillations in [Ca2+]i, and, under voltage clamp, equivalent membrane hyperpolarizations caused [Ca2+]i to increase, often in excess of 1 microM, from resting values near 100 nM. Image analysis showed that the voltage stimulus evoked a wave of high [Ca2+]i that spread centripetally from the peripheral cytoplasm within 5-10 s and relaxed over 40-60 s thereafter. The [Ca2+]i increases showed a voltage threshold near -120 mV and were sensitive to external Ca2+ concentration. Substituting Mn2+ for Ca2+ to quench Fura2 fluorescence showed that membrane hyperpolarization triggered a divalent influx. ABA affected the voltage threshold for the [Ca2+]i rise, its amplitude, and its duration. In turn, membrane voltage determined the ability of ABA to raise [Ca2+]i. These results demonstrate a capacity for voltage to evoke [Ca2+]i increases, they point to a dual interaction with ABA in triggering and propagating [Ca2+]i increases, and they implicate a role for voltage in "conditioning" [Ca2+]i signals that regulate ion channels for stomatal function.
Figures
Similar articles
-
Repetitive increases in cytosolic Ca2+ of guard cells by abscisic acid activation of nonselective Ca2+ permeable channels.Proc Natl Acad Sci U S A. 1990 Dec;87(23):9305-9. doi: 10.1073/pnas.87.23.9305. Proc Natl Acad Sci U S A. 1990. PMID: 2174559 Free PMC article.
-
Ca2+ channels at the plasma membrane of stomatal guard cells are activated by hyperpolarization and abscisic acid.Proc Natl Acad Sci U S A. 2000 Apr 25;97(9):4967-72. doi: 10.1073/pnas.080068897. Proc Natl Acad Sci U S A. 2000. PMID: 10781106 Free PMC article.
-
Cytosolic abscisic acid activates guard cell anion channels without preceding Ca2+ signals.Proc Natl Acad Sci U S A. 2005 Mar 15;102(11):4203-8. doi: 10.1073/pnas.0500146102. Epub 2005 Mar 7. Proc Natl Acad Sci U S A. 2005. PMID: 15753314 Free PMC article.
-
Signal transduction and ion channels in guard cells.Philos Trans R Soc Lond B Biol Sci. 1998 Sep 29;353(1374):1475-88. doi: 10.1098/rstb.1998.0303. Philos Trans R Soc Lond B Biol Sci. 1998. PMID: 9800209 Free PMC article. Review.
-
Visualisation and measurement of the calcium message in guard cells.Symp Soc Exp Biol. 1991;45:177-90. Symp Soc Exp Biol. 1991. PMID: 1843407 Review.
Cited by
-
Systems dynamic modeling of the stomatal guard cell predicts emergent behaviors in transport, signaling, and volume control.Plant Physiol. 2012 Jul;159(3):1235-51. doi: 10.1104/pp.112.197350. Epub 2012 May 25. Plant Physiol. 2012. PMID: 22635112 Free PMC article.
-
A charged existence: A century of transmembrane ion transport in plants.Plant Physiol. 2024 Apr 30;195(1):79-110. doi: 10.1093/plphys/kiad630. Plant Physiol. 2024. PMID: 38163639 Free PMC article. Review.
-
ABA activates multiple Ca(2+) fluxes in stomatal guard cells, triggering vacuolar K(+)(Rb(+)) release.Proc Natl Acad Sci U S A. 2000 Oct 24;97(22):12361-8. doi: 10.1073/pnas.220417197. Proc Natl Acad Sci U S A. 2000. PMID: 11027317 Free PMC article.
-
Hypersensitivity of abscisic acid-induced cytosolic calcium increases in the Arabidopsis farnesyltransferase mutant era1-2.Plant Cell. 2002 Jul;14(7):1649-62. doi: 10.1105/tpc.010448. Plant Cell. 2002. PMID: 12119381 Free PMC article.
-
Convergence of calcium signaling pathways of pathogenic elicitors and abscisic acid in Arabidopsis guard cells.Plant Physiol. 2002 Dec;130(4):2152-63. doi: 10.1104/pp.012187. Plant Physiol. 2002. PMID: 12481099 Free PMC article.
References
LinkOut - more resources
Full Text Sources
Other Literature Sources
Miscellaneous
