. 1998 Apr 6;187(7):985-96.
doi: 10.1084/jem.187.7.985.

Chronic inflammation and susceptibility to bacterial infections in mice lacking the polypeptide (p)105 precursor (NF-kappaB1) but expressing p50

Affiliations

Chronic inflammation and susceptibility to bacterial infections in mice lacking the polypeptide (p)105 precursor (NF-kappaB1) but expressing p50

H Ishikawa et al. J Exp Med. .

Abstract

The polypeptide (p)50 molecule, a subunit of nuclear factor (NF)-kappaB, is produced after proteolytic processing of the p105 precursor (NF-kappaB1). Although the p105 precursor has been postulated to play a role in the regulation of the Rel/NF-kappaB activity, its physiological relevance remains unclear. To investigate that, we generated mutant mice lacking the COOH terminal half of the p105 precursor, but expressing the p50 product (p105-/-). These mutant mice displayed an inflammatory phenotype composed of lymphocytic infiltration in lungs and liver, and an increased susceptibility to opportunistic infections. Enlargement of multiple lymph nodes, splenomegaly due to erythrocytic extramedullary hematopoiesis, and lymphoid hyperplasia were also observed in p105-/- mice. Cytokine production in p105-/- macrophages was severely impaired, whereas proliferative responses of p105-/- B cells were increased. T cell functions were only moderately impaired in mutant mice. Loss of p105 also led to enhanced constitutive p50 homodimer and inducible NF-kappaB activities in unstimulated and stimulated cells, respectively. As several genes regulated by Rel/NF-kappaB were upregulated in p105-/- thymus but downregulated in p105-/- macrophages, the enhanced p50 homodimers appear to function as transcriptional activators or repressors, depending on the cell type. Thus, the p105 precursor is indispensable in the control of p50 activity, and lack of the precursor has distinct effects on different cells.


Figures

Figure 1
Figure 1
Generation of p105−/− mice. (A) Targeting strategy of the ankyrin-encoding region of the nfkb1 gene. The relevant structure of the murine nfkb1 gene is shown at the top. Targeting vector pPNT/IκBγ II and the targeted allele are shown at the middle and bottom, respectively. Closed boxes, exons of nfkb1 gene; open boxes, the SV40 p(A), phosphoglycerate kinase (PGK)-neo, and PGK-tk cassettes. The position of EcoRI and EcoRV sites are indicated by I and V, respectively. The diagnostic restriction fragments used for Southern blot analysis are indicated at the top (wild-type allele) and bottom (targeted allele). The DNA fragments used as 5′ external (EE), 5′ internal (XX), 3′ internal (E), and neo-specific (PP620) probes are indicated at the bottom. (B) Genotype analysis of pups generated from p105+/− intercrosses. Tail DNAs were digested with EcoRI, followed by Southern blot analysis using the 5′ internal probe XX. The wild-type allele is indicated by a 11.2-kb band, whereas the recombinant allele is represented by a 6.5-kb band. (C) Lack of p105 in homozygous mutants. Whole tissue extracts from thymus were subjected to Western blot analysis using a p50 antibody. Specific signals for the p50 isoform, p50, and p105 proteins are indicated by arrows.
Figure 1
Figure 1
Generation of p105−/− mice. (A) Targeting strategy of the ankyrin-encoding region of the nfkb1 gene. The relevant structure of the murine nfkb1 gene is shown at the top. Targeting vector pPNT/IκBγ II and the targeted allele are shown at the middle and bottom, respectively. Closed boxes, exons of nfkb1 gene; open boxes, the SV40 p(A), phosphoglycerate kinase (PGK)-neo, and PGK-tk cassettes. The position of EcoRI and EcoRV sites are indicated by I and V, respectively. The diagnostic restriction fragments used for Southern blot analysis are indicated at the top (wild-type allele) and bottom (targeted allele). The DNA fragments used as 5′ external (EE), 5′ internal (XX), 3′ internal (E), and neo-specific (PP620) probes are indicated at the bottom. (B) Genotype analysis of pups generated from p105+/− intercrosses. Tail DNAs were digested with EcoRI, followed by Southern blot analysis using the 5′ internal probe XX. The wild-type allele is indicated by a 11.2-kb band, whereas the recombinant allele is represented by a 6.5-kb band. (C) Lack of p105 in homozygous mutants. Whole tissue extracts from thymus were subjected to Western blot analysis using a p50 antibody. Specific signals for the p50 isoform, p50, and p105 proteins are indicated by arrows.
Figure 2
Figure 2
Gross abnormalities of p105−/− mice. (A) Mortality of control and heterozygotes (circles, n = 22) and p105−/− (triangles, n = 15) mice. Survival is shown as a percentage of the total initial number of control or p105−/− mice. (B) Histopathology of p105−/− mice. Spleen (a and b), lymph node (LN; c and d), lung (e and f), and liver (g and h) from 6-wk-old, and bone marrow (BM; i and j) from 12-wk-old control (+/+; a, c, e, g, and i) and p105−/− (−/−; b, d, f, h, and j) animals stained with hematoxylin and eosin. Marked enlargement of the spleen and lymph node in mutant mice (inset, a and b, increased erythrocytic extramedullary hematopoiesis; the white pulp was also expanded). The paracortical area of lymph nodes are expanded in mutant mice, but overall lymphocyte numbers are decreased (inset, c and d). The liver and lung contain perivascular lymphoid infiltration in mutant mice. Relative hyperplasia in the bone marrow with an associated decrease in erythrocytic precursor cells in mutant mice. (C) Splenic sections from 6-wk-old control (+/+; a and c) and p105−/− (−/−; b and d) mice immunized with SRBCs. Sections were incubated with rat anti–mouse IgD (a and b) and biotinylated PNA (c and d). Mantle zones in mutant mice are less compact (compare a and b). The PNA positive cell area corresponding to centrocytes is markedly expanded in the mutant mice as compared to the control animals (compare c and d). Original magnifications: 2 B, a and b, 62.5; c and d, 125; e and f, 250; g and h, 500; i and j, 1,000; inset, a and b, 500; and inset, c and d, 2,500; 2 C, 125.
Figure 2
Figure 2
Gross abnormalities of p105−/− mice. (A) Mortality of control and heterozygotes (circles, n = 22) and p105−/− (triangles, n = 15) mice. Survival is shown as a percentage of the total initial number of control or p105−/− mice. (B) Histopathology of p105−/− mice. Spleen (a and b), lymph node (LN; c and d), lung (e and f), and liver (g and h) from 6-wk-old, and bone marrow (BM; i and j) from 12-wk-old control (+/+; a, c, e, g, and i) and p105−/− (−/−; b, d, f, h, and j) animals stained with hematoxylin and eosin. Marked enlargement of the spleen and lymph node in mutant mice (inset, a and b, increased erythrocytic extramedullary hematopoiesis; the white pulp was also expanded). The paracortical area of lymph nodes are expanded in mutant mice, but overall lymphocyte numbers are decreased (inset, c and d). The liver and lung contain perivascular lymphoid infiltration in mutant mice. Relative hyperplasia in the bone marrow with an associated decrease in erythrocytic precursor cells in mutant mice. (C) Splenic sections from 6-wk-old control (+/+; a and c) and p105−/− (−/−; b and d) mice immunized with SRBCs. Sections were incubated with rat anti–mouse IgD (a and b) and biotinylated PNA (c and d). Mantle zones in mutant mice are less compact (compare a and b). The PNA positive cell area corresponding to centrocytes is markedly expanded in the mutant mice as compared to the control animals (compare c and d). Original magnifications: 2 B, a and b, 62.5; c and d, 125; e and f, 250; g and h, 500; i and j, 1,000; inset, a and b, 500; and inset, c and d, 2,500; 2 C, 125.
Figure 3
Figure 3
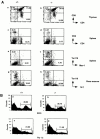
Flow cytometry analysis of hematopoietic cells in p105−/− mice. (A) Thymocytes stained for CD4 and CD8 (a and b), splenocytes stained for CD4 and CD8 (c and d) or Mac-1 and Ter 119 (e and f  ), and bone marrow cells stained for Gr-1 and Ter 119 (g and h) from 6-wk-old control (+/+; a, c, e, and g), and p105−/− (−/−; b, d, f, and h) mice. Percentages of positive cells are indicated. (B) Histogram of the relative number of splenocytes stained with B220 (a and b) or Thy 1.2 (c and d) from 6-wk-old control (+/+; a and c), and p105 −/− (−/−; b and d).
Figure 4
Figure 4
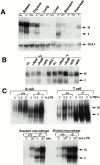
Accumulation of the p50 homodimer activity in p105−/− mice. Increased κB-binding activity in several tissues of p105−/− mice. (A) Nuclear extracts (2 μg) from spleen, thymus, lung, liver, stomach, and pancreas were used for EMSA. A κB palindromic sequence was used to detect the κB-binding activities. The octamer-specific motif was used as a control. (B) Nuclear extracts from spleen were incubated with a palindromic κB-binding site and treated with specific antisera against the different members of the Rel/NF-κB family before EMSA. P.I., preimmune serum. (C) Induction of NF-κB activity after stimulation of different cells. Nuclear extracts from untreated control and p105−/− B cells, T cells, and macrophages or treated with LPS (B cells and macrophages) or TNF-α (T cells) for the indicated period were analyzed by EMSA using a κB probe. NF-κB heterodimers and p50 homodimers are indicated as band II and I, respectively.
Figure 5
Figure 5
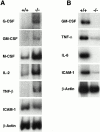
Dual role of p50 homodimers in gene expression in p105−/− mice. (A) Total RNA (0.5 μg) isolated from thymus of 3-wk-old animals or (B) total RNA (2 μg) isolated from resident macrophages of 4-wk-old animals was used for RT-PCR analysis using specific primers as indicated.
Figure 6
Figure 6
Proliferative responses of lymphocytes. (A) B cell proliferation. [3H]Thymidine incorporation of splenic B cells from 3-wk-old control (closed circles) or p105−/− (open circles) mice treated for 48 h with the indicated concentrations of either anti-IgM or LPS. Values of [3H]thymidine incorporation are shown by mean ± SD. (B) T cell proliferation. [3H]Thymidine incorporation of splenic T cells from 3-wk-old control (closed bars) or p105−/− (open bars) mice treated for 48 h with either PMA plus PHA, anti-CD3, or anti-CD3 plus anti-CD28.
Figure 7
Figure 7
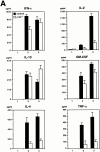
Cytokine production in T cells or macrophages. (A) Secretion of IL-2, IL-4, and TNF-α is decreased in p105−/− T cells. Splenic T cells purified from 3-wk-old control (closed bars) or p105−/− (open bars) untreated (1) or treated with anti-CD3 (2) or anti-CD3 plus anti-CD28 (3) for 24 h. The cytokine levels in the supernatants were determined by ELISA. (B) Cytokines released from macrophages. Peritoneal macrophages purified from 3-wk-old mice untreated (−) or treated with (+) LPS and IFN-γ for 72 h. The cytokine levels are indicated by mean values ± SD.
Figure 7
Figure 7
Cytokine production in T cells or macrophages. (A) Secretion of IL-2, IL-4, and TNF-α is decreased in p105−/− T cells. Splenic T cells purified from 3-wk-old control (closed bars) or p105−/− (open bars) untreated (1) or treated with anti-CD3 (2) or anti-CD3 plus anti-CD28 (3) for 24 h. The cytokine levels in the supernatants were determined by ELISA. (B) Cytokines released from macrophages. Peritoneal macrophages purified from 3-wk-old mice untreated (−) or treated with (+) LPS and IFN-γ for 72 h. The cytokine levels are indicated by mean values ± SD.
Figure 8
Figure 8
Basal and specific Ig production in vivo. (A) Ig isotype concentrations. The concentration of serum Ig in unimmunized control (closed circles), heterozygotes (closed triangles), and p105−/− (open circles) mice was determined by isotype-specific ELISA. (B) T cell–dependent antibody production. Mice were immunized with NP-KLH and the levels of NP-specific IgG1 were determined 1, 2, and 3 wk after immunization. (C) T cell–independent antibody production. Mice were immunized with NP-LPS and the levels of NP-specific IgG3 were determined 1, 2, and 3 wk after immunization. Each symbol represents the value obtained from one animal. Horizontal bars, mean values.

Similar articles

Cited by

References

    1. Grilli M, Chiu J-S, Lenardo MJ. NF-κB and Rel-participants in a multiform transcriptional regulatory system. Int Rev Cytol. 1993;143:1–62. - PubMed
    1. Baeuerle PA, Henkel T. Function and activation of NF-κB in the immune system. Annu Rev Immunol. 1994;12:141–179. - PubMed
    1. Kopp EB, Ghosh S. NF-κB and Rel proteins in innate immunity. Adv Immunol. 1995;58:1–27. - PubMed
    1. Miyamoto S, Verma IM. Rel/NF–κB/IκB story. Adv Cancer Res. 1995;66:255–292. - PubMed
    1. Beg AA, Baldwin AS., Jr The IκB proteins: multifunctional regulators of Rel/NF-κB transcription factors. Genes Dev. 1993;7:2063–2070. - PubMed

MeSH terms