. 1998 Mar 16;187(6):917-28.
doi: 10.1084/jem.187.6.917.

Essential role of induced nitric oxide in the initiation of the inflammatory response after hemorrhagic shock

Affiliations

Essential role of induced nitric oxide in the initiation of the inflammatory response after hemorrhagic shock

C Hierholzer et al. J Exp Med. .

Abstract

Resuscitation from hemorrhagic shock induces profound changes in the physiologic processes of many tissues and activates inflammatory cascades that include the activation of stress transcriptional factors and upregulation of cytokine synthesis. This process is accompanied by acute organ damage (e.g., lungs and liver). We have previously demonstrated that the inducible nitric oxide synthase (iNOS) is expressed during hemorrhagic shock. We postulated that nitric oxide production from iNOS would participate in proinflammatory signaling. Using the iNOS inhibitor N6-(iminoethyl)-L-lysine or iNOS knockout mice we found that the activation of the transcriptional factors nuclear factor kappaB and signal transducer and activator of transcription 3 and increases in IL-6 and G-CSF messenger RNA levels in the lungs and livers measured 4 h after resuscitation from hemorrhagic shock were iNOS dependent. Furthermore, iNOS inhibition resulted in a marked reduction of lung and liver injury produced by hemorrhagic shock. Thus, induced nitric oxide is essential for the upregulation of the inflammatory response in resuscitated hemorrhagic shock and participates in end organ damage under these conditions.


Figures
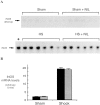
Figure 1
Figure 1
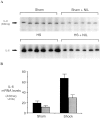
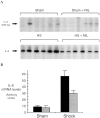
Semiquantitative RT-PCR of iNOS mRNA from lungs of rats subjected to hemorrhagic shock and killed 4 h after resuscitation. RT-PCR reactions were performed using total RNA (2.5 μg) from the lungs of shock and sham animals receiving L-NIL (n = 6, gray bars) or saline (n = 6, black bars). Reaction products were separated on polyacrylamide gels. The gels were dried and exposed to a PhosphorImaging screen and developed using a PhosphorImager (A). In B, the radioactive signal in the region corresponding to the predicted amplified fragment of rat iNOS mRNA was quantitated using scanner laser densitometry and ImageQuant software and plotted. Values shown represent mean ± SEM. The differences between each shock and sham group were significant (P = 0.001 for each group).
Figure 2
Figure 2
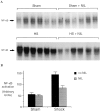
Semiquantitative RT-PCR of IL-6 mRNA (A and B) and G-CSF mRNA (C and D) in lungs of rats subjected to hemorrhagic shock or sham procedure without (black bars) and with (gray bars) L-NIL treatment. RT-PCR reactions were performed and analyzed as described in the legend to Fig. 1. The differences between each shock and sham group were significant (P ⩽0.03 for each group). The differences between L-NIL–treated shock and untreated shock groups were significant (P = 0.004 for IL-6 and P = 0.04 for G-CSF).
Figure 2
Figure 2
Semiquantitative RT-PCR of IL-6 mRNA (A and B) and G-CSF mRNA (C and D) in lungs of rats subjected to hemorrhagic shock or sham procedure without (black bars) and with (gray bars) L-NIL treatment. RT-PCR reactions were performed and analyzed as described in the legend to Fig. 1. The differences between each shock and sham group were significant (P ⩽0.03 for each group). The differences between L-NIL–treated shock and untreated shock groups were significant (P = 0.004 for IL-6 and P = 0.04 for G-CSF).
Figure 3
Figure 3
Activation of NF-κB in the lungs of rats subjected to hemorrhagic shock. In A, EMSA was performed using radiolabeled NF-κB–binding element and 20 μg of protein extracts of shock and sham animals without or with L-NIL treatment. In B, the radioactive signal was quantitated by PhosphorImager analysis and plotted. The values shown are mean ± SEM. Black bars, untreated animals; gray bars, L-NIL–treated animals. The NF-κB complex in the shock groups was 2.5-fold greater than in sham controls (P = 0.001) and was reduced by 70% by L-NIL treatment (P = 0.003). In C, extracts (20 μg) from untreated shock animals were incubated with (+) or without (−) a specific antibody against the p50 portion of the NF-κB heterodimer. In D, extracts (20 μg) of the lung of a representative shock animal were incubated with the indicated fold excess of unlabeled duplex oligonucleotide or an unrelated duplex oligonucleotide (hSIE).
Figure 3
Figure 3
Activation of NF-κB in the lungs of rats subjected to hemorrhagic shock. In A, EMSA was performed using radiolabeled NF-κB–binding element and 20 μg of protein extracts of shock and sham animals without or with L-NIL treatment. In B, the radioactive signal was quantitated by PhosphorImager analysis and plotted. The values shown are mean ± SEM. Black bars, untreated animals; gray bars, L-NIL–treated animals. The NF-κB complex in the shock groups was 2.5-fold greater than in sham controls (P = 0.001) and was reduced by 70% by L-NIL treatment (P = 0.003). In C, extracts (20 μg) from untreated shock animals were incubated with (+) or without (−) a specific antibody against the p50 portion of the NF-κB heterodimer. In D, extracts (20 μg) of the lung of a representative shock animal were incubated with the indicated fold excess of unlabeled duplex oligonucleotide or an unrelated duplex oligonucleotide (hSIE).
Figure 4
Figure 4
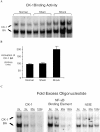
Increased CK-1–binding activity (BA) of lung extracts of shock animals. In A, EMSA was performed using 20 μg of extract of lung from animals subjected to hemorrhagic shock, sham animals, normal control animals, and duplex oligonucleotide. CK-1 is based on an element within the promoter region of the G-CSF gene that contains a functional NF-κB binding site. In B, CK-1 BA was quantitated by PhosphorImager analysis and the mean and ± SEM plotted. CK-1 BA in shock animals was increased twofold over sham animals (P = 0.03). In C, EMSA was performed using extracts of a representative shock lung and CK-1 duplex oligonucleotide in the presence of the indicated unlabeled duplex oligonucleotides at the indicated fold excess. The position of the CK-1–binding activity (CK-1, BA) is indicated on the left.
Figure 5
Figure 5
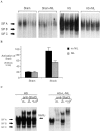
Increased Stat3 activation in extracts of lungs of animals subjected to hemorrhagic shock and resuscitation. In A, EMSA was performed using the hSIE duplex oligonucleotide and 20 μg of extracts from shock animals (hemorrhagic shock, HS) or sham animals treated or untreated with L-NIL. The position of the SIF-A, -B, and -C complex are indicated. In B, the SIF-A band was quantitated by PhosphorImager analysis and the mean ± SEM for each group plotted. The mean of the SIF-A complexes in the shock group was 4.7-fold greater than in sham controls (P = 0.002) and was significantly reduced by L-NIL treatment (P = 0.04). In C, extracts of a representative lung were incubated with antibodies specific for Stat3α, Stat3β, or with both antibodies. The position of the SIF-A, -B, and -C complexes and the residual SIF-A complex after supershift of Stat3α and Stat3β (Stat3γ) are indicated.
Figure 6
Figure 6
Lung injury is attenuated after L-NIL treatment of shock animals. The lungs of sham animals, untreated shock animals, and L-NIL–treated shock animals obtained 4 h after resuscitation were inflated and fixed in formaldehyde, and then sectioned, and examined at ×400. Lung injury was assessed histologically using sections stained by hematoxylin and eosin (top), and PMN accumulation was assessed by staining for MPO (bottom). In B, 10 random fields of each MPO-stained lung specimen were blindly scored for number of intensely MPO-positive PMNs. The scores were pooled for untreated animals (black bars) and L-NIL-treated animals (gray bars) and the means ± SEM were plotted. The increase in shock animals compared to sham animals was significant (P = 0.001); the decrease in shock animals treated with L-NIL compared to untreated animals was significant (P = 0.02). In C, the wet to dry ratio of each sham and shock animal was corrected by subtracting the mean value for normal animals (4.15 ± 0.3, n = 6) and the increased mean ± SEM of animals untreated (black bars) or L-NIL–treated (gray bars) was plotted. The increase in wet to dry ratio in shock animals compared to sham animals was significant (P = 0.01). The decrease in wet to dry ratio in L-NIL–treated shock animals compared to untreated shock animals was significant (P = 0.03).
Figure 6
Figure 6
Lung injury is attenuated after L-NIL treatment of shock animals. The lungs of sham animals, untreated shock animals, and L-NIL–treated shock animals obtained 4 h after resuscitation were inflated and fixed in formaldehyde, and then sectioned, and examined at ×400. Lung injury was assessed histologically using sections stained by hematoxylin and eosin (top), and PMN accumulation was assessed by staining for MPO (bottom). In B, 10 random fields of each MPO-stained lung specimen were blindly scored for number of intensely MPO-positive PMNs. The scores were pooled for untreated animals (black bars) and L-NIL-treated animals (gray bars) and the means ± SEM were plotted. The increase in shock animals compared to sham animals was significant (P = 0.001); the decrease in shock animals treated with L-NIL compared to untreated animals was significant (P = 0.02). In C, the wet to dry ratio of each sham and shock animal was corrected by subtracting the mean value for normal animals (4.15 ± 0.3, n = 6) and the increased mean ± SEM of animals untreated (black bars) or L-NIL–treated (gray bars) was plotted. The increase in wet to dry ratio in shock animals compared to sham animals was significant (P = 0.01). The decrease in wet to dry ratio in L-NIL–treated shock animals compared to untreated shock animals was significant (P = 0.03).
Figure 7
Figure 7
Semiquantitative RT-PCR of IL-6 mRNA (A and B) and G-CSF mRNA (C and D) in livers of rats subjected to hemorrhagic shock or sham procedure without (black bars) and with (gray bars) L-NIL treatment. RT-PCR reactions were performed and analyzed as described in the legend to Fig. 1. The differences between each shock and sham group were significant (P <0.01 for each group). IL-6 mRNA levels were decreased by 56% (P = 0.01), whereas G-CSF mRNA levels decreased by 51% (P = 0.02) in L-NIL–treated shock animals compared to untreated shock animals.
Figure 7
Figure 7
Semiquantitative RT-PCR of IL-6 mRNA (A and B) and G-CSF mRNA (C and D) in livers of rats subjected to hemorrhagic shock or sham procedure without (black bars) and with (gray bars) L-NIL treatment. RT-PCR reactions were performed and analyzed as described in the legend to Fig. 1. The differences between each shock and sham group were significant (P <0.01 for each group). IL-6 mRNA levels were decreased by 56% (P = 0.01), whereas G-CSF mRNA levels decreased by 51% (P = 0.02) in L-NIL–treated shock animals compared to untreated shock animals.
Figure 8
Figure 8
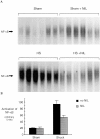
Activation of NF-κB and Stat3 in the liver of rats subjected to hemorrhagic shock. In A, EMSA was performed using radiolabeled NF-κB duplex oligonucleotide (A) or radiolabeled hSIE (C) and 20 μg of protein extracts of shock and sham animals without or with L-NIL treatment. The positions of NF-κB and the SIF-A, -B, and -C complexes are indicated on the left. In B and D, the radioactive signal was quantitated by PhosphorImager analysis and the mean ± SEM plotted. The values shown are mean ± SEM. Black bars, untreated animals (n = 5); gray bars, L-NIL– treated animals. In shocked animals, the activation of NF-κB and the activation of Stat3 were increased significantly compared to sham animals (P = 0.002 and P = 0.001, respectively). after L-NIL treatment NF-κB activation was reduced 83% (P = 0.001) and activation of Stat3 was reduced 58% (P = 0.001) in shocked animals compared to untreated shock animals.
Figure 8
Figure 8
Activation of NF-κB and Stat3 in the liver of rats subjected to hemorrhagic shock. In A, EMSA was performed using radiolabeled NF-κB duplex oligonucleotide (A) or radiolabeled hSIE (C) and 20 μg of protein extracts of shock and sham animals without or with L-NIL treatment. The positions of NF-κB and the SIF-A, -B, and -C complexes are indicated on the left. In B and D, the radioactive signal was quantitated by PhosphorImager analysis and the mean ± SEM plotted. The values shown are mean ± SEM. Black bars, untreated animals (n = 5); gray bars, L-NIL– treated animals. In shocked animals, the activation of NF-κB and the activation of Stat3 were increased significantly compared to sham animals (P = 0.002 and P = 0.001, respectively). after L-NIL treatment NF-κB activation was reduced 83% (P = 0.001) and activation of Stat3 was reduced 58% (P = 0.001) in shocked animals compared to untreated shock animals.
Figure 9
Figure 9
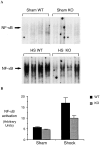
NF-κB and Stat3 activation in the lungs of wild-type (WT) and iNOS knockout (KO) mice subjected to hemorrhagic shock. EMSA was performed using radiolabeled NF-κB duplex oligonucleotide (A) or radiolabeled hSIE (C) and 20 μg of protein extracts of shock and sham wild-type or knockout mice. The position of NF-κB and the SIF-A, -B, and -C complexes are indicated on the left. In B and D, the radioactive signal was quantitated by PhosphorImager analysis and plotted. The values shown are mean ± SEM. Black bars, wild-type mice (n = 5); gray bars, knockout mice (n = 5). In shocked wild-type mice, the activation of NF-κB and the activation of Stat3 homodimer (SIFA) were increased significantly compared to sham wild-type mice (P ⩽0.01). In shocked knockout mice, NF-κB activation was reduced 44% (P = 0.01) and activation of Stat3 homodimer (SIF-A) was reduced 51% (P = 0.04) compared to shocked wild-type mice.
Figure 9
Figure 9
NF-κB and Stat3 activation in the lungs of wild-type (WT) and iNOS knockout (KO) mice subjected to hemorrhagic shock. EMSA was performed using radiolabeled NF-κB duplex oligonucleotide (A) or radiolabeled hSIE (C) and 20 μg of protein extracts of shock and sham wild-type or knockout mice. The position of NF-κB and the SIF-A, -B, and -C complexes are indicated on the left. In B and D, the radioactive signal was quantitated by PhosphorImager analysis and plotted. The values shown are mean ± SEM. Black bars, wild-type mice (n = 5); gray bars, knockout mice (n = 5). In shocked wild-type mice, the activation of NF-κB and the activation of Stat3 homodimer (SIFA) were increased significantly compared to sham wild-type mice (P ⩽0.01). In shocked knockout mice, NF-κB activation was reduced 44% (P = 0.01) and activation of Stat3 homodimer (SIF-A) was reduced 51% (P = 0.04) compared to shocked wild-type mice.
Figure 10
Figure 10
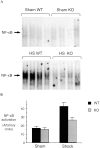
NF-κB and Stat3 activation in the liver of wild-type (WT) and iNOS knockout (KO) mice subjected to hemorrhagic shock. EMSA was performed using radiolabeled NF-κB duplex oligonucleotide (A) or radiolabeled hSIE (C) and 20 μg of protein extracts of shock and sham wild-type or knockout mice. The position of NF-κB and the SIF-A, -B, and -C complexes are indicated on the left. In B and D, the radioactive signal was quantitated by PhosphorImager analysis and plotted. The values shown are mean ± SEM. Black bars, wild-type mice (n = 5); gray bars, knockout mice (n = 5). In shocked wild-type mice, the activation of NF-κB and the activation of Stat3 homodimer (SIFA) were increased significantly compared to sham wild-type mice (P ⩽0.01). In shocked knockout mice NF-κB activation was reduced 62% (P = 0.02) and activation of Stat3 homodimer (SIFA) was reduced 54% (P = 0.01) compared to shocked wild-type mice.
Figure 10
Figure 10
NF-κB and Stat3 activation in the liver of wild-type (WT) and iNOS knockout (KO) mice subjected to hemorrhagic shock. EMSA was performed using radiolabeled NF-κB duplex oligonucleotide (A) or radiolabeled hSIE (C) and 20 μg of protein extracts of shock and sham wild-type or knockout mice. The position of NF-κB and the SIF-A, -B, and -C complexes are indicated on the left. In B and D, the radioactive signal was quantitated by PhosphorImager analysis and plotted. The values shown are mean ± SEM. Black bars, wild-type mice (n = 5); gray bars, knockout mice (n = 5). In shocked wild-type mice, the activation of NF-κB and the activation of Stat3 homodimer (SIFA) were increased significantly compared to sham wild-type mice (P ⩽0.01). In shocked knockout mice NF-κB activation was reduced 62% (P = 0.02) and activation of Stat3 homodimer (SIFA) was reduced 54% (P = 0.01) compared to shocked wild-type mice.
Figure 11
Figure 11
Hepatic injury in wild-type (WT) and iNOS knockout (KO) mice subjected to hemorrhagic shock. The release of the hepatocellular enzyme ALT into plasma was used as an index of hepatic injury. ALT release (IU/liter) from shock and sham wild-type or knockout mice was measured using an autoanalyzer (RA 500; Technitron) and plotted. Values shown are mean ± SEM. Black bars, wild-type (WT) animals (n = 5); gray bars, knockout (KO) animals (n = 5). In shocked wild-type mice, ALT levels demonstrated a 40-fold increase compared to sham wild-type mice (P <0.01). In shocked knockout mice, ALT levels were reduced 80% (P <0.01) compared to shocked wild-type mice.

Similar articles

Cited by

References

    1. Chaudry, I.H., W. Ertel, and A. Ayala. 1993. Alterations in inflammatory cytokine production following hemorrhage and resuscitation. In Shock, Sepsis, and Organ Failure, Third Wiggers Bernard Conference. G. Schlag, H. Redl, and D.L. Traber, editors. Springer Verlag, Berlin. 73–127.
    1. Cotran, R.S., V. Kumar, and S.L. Robbins, editors. 1989. Robbins Pathologic Basis of Disease. 4th ed. W.B. Saunders Company, Philadelphia. 39–71.
    1. Le Tulzo Y, Shenkar R, Kaneko D, Moine P, Fantuzzi G, Dinarello CA, Abraham E. Hemorrhage increases cytokine expression in lung mononuclear cells in mice: involvement of catecholamines in nuclear factor–κB regulation and cytokine expression. J Clin Invest. 1997;99:1516–1524. - PMC - PubMed
    1. Deitch EA, Morrison J, Berg R, Specian RD. Effect of hemorrhagic shock on bacterial translocation, intestinal morphology, and intestinal permeability in conventional and antibiotic-decontaminated rats. Crit Care Med. 1990;18:529–536. - PubMed
    1. Peitzman AB, Udekwu AO, Ochoa J, Smith S. Bacterial translocation in trauma patients. J Trauma. 1991;31:1083–1087. - PubMed

Publication types

MeSH terms