

SR proteins are sufficient for exon bridging across an intron
- PMID: 9482856
- PMCID: PMC19283
- DOI: 10.1073/pnas.95.5.2163
SR proteins are sufficient for exon bridging across an intron
Abstract
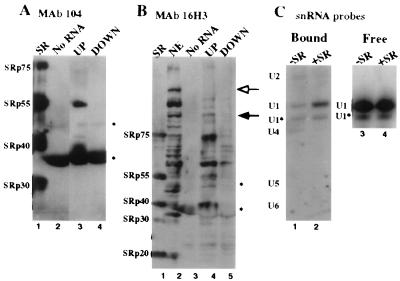
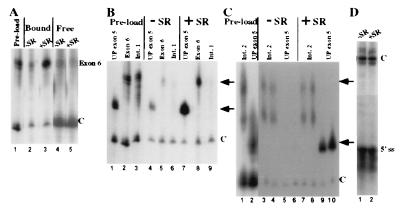
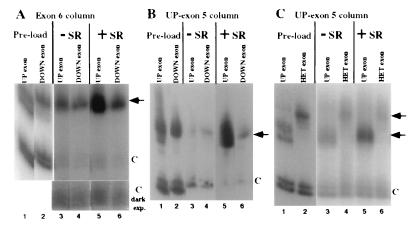
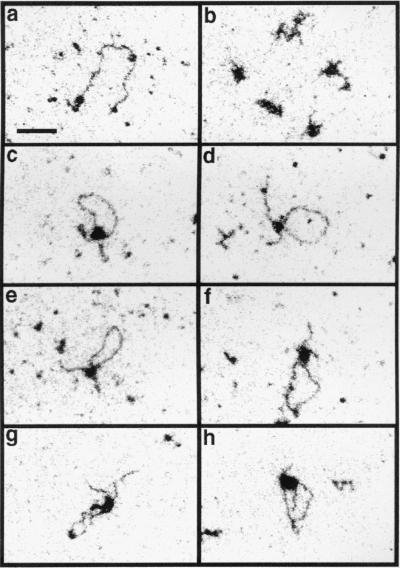
We have developed a defined system to characterize the role of SR proteins and exonic enhancers in directly promoting splice-site interactions across an intron. Using RNA affinity chromatography, we find that SR proteins alone are sufficient to promote the specific association of the enhancer-containing exon 5 with the adjoining exon 6 from avian cardiac troponin-T. Direct visualization of this exon/exon association by electron spectroscopic imaging shows it to be highly specific. Furthermore, using in vivo characterized mutants of exon 5, we also show that this exon/exon association depends on the splicing enhancer within exon 5. These results suggest a model by which SR proteins may function through exonic enhancers to directly promote exon bridging.
Figures
Similar articles
-
Serine/arginine-rich protein-dependent suppression of exon skipping by exonic splicing enhancers.Proc Natl Acad Sci U S A. 2005 Apr 5;102(14):5002-7. doi: 10.1073/pnas.0500543102. Epub 2005 Mar 7. Proc Natl Acad Sci U S A. 2005. PMID: 15753297 Free PMC article.
-
Specific binding of an exonic splicing enhancer by the pre-mRNA splicing factor SRp55.RNA. 1998 Jan;4(1):11-23. RNA. 1998. PMID: 9436904 Free PMC article.
-
Strong RNA splicing enhancers identified by a modified method of cycled selection interact with SR protein.J Biol Chem. 2001 Sep 7;276(36):33833-9. doi: 10.1074/jbc.M102957200. Epub 2001 Jul 13. J Biol Chem. 2001. PMID: 11454855
-
The CD44 alternative v9 exon contains a splicing enhancer responsive to the SR proteins 9G8, ASF/SF2, and SRp20.J Biol Chem. 2003 Aug 29;278(35):32943-53. doi: 10.1074/jbc.M301090200. Epub 2003 Jun 24. J Biol Chem. 2003. PMID: 12826680
-
SR proteins as potential targets for therapy.Prog Mol Subcell Biol. 2006;44:65-87. doi: 10.1007/978-3-540-34449-0_4. Prog Mol Subcell Biol. 2006. PMID: 17076265 Review.
Cited by
-
Clk/STY (cdc2-like kinase 1) and Akt regulate alternative splicing and adipogenesis in 3T3-L1 pre-adipocytes.PLoS One. 2013;8(1):e53268. doi: 10.1371/journal.pone.0053268. Epub 2013 Jan 4. PLoS One. 2013. PMID: 23308182 Free PMC article.
-
RNA modifications in cardiovascular health and disease.Nat Rev Cardiol. 2023 May;20(5):325-346. doi: 10.1038/s41569-022-00804-8. Epub 2022 Dec 5. Nat Rev Cardiol. 2023. PMID: 36471164 Review.
-
Interplay between exonic splicing enhancers, mRNA processing, and mRNA surveillance in the dystrophic Mdx mouse.PLoS One. 2007 May 9;2(5):e427. doi: 10.1371/journal.pone.0000427. PLoS One. 2007. PMID: 17487273 Free PMC article.
-
Multiple roles for SR proteins in trans splicing.Mol Cell Biol. 2002 Aug;22(15):5337-46. doi: 10.1128/MCB.22.15.5337-5346.2002. Mol Cell Biol. 2002. PMID: 12101229 Free PMC article.
-
Developmental regulation of SR protein phosphorylation and activity.Genes Dev. 1999 Jun 15;13(12):1513-8. doi: 10.1101/gad.13.12.1513. Genes Dev. 1999. PMID: 10385619 Free PMC article.
References
-
- Moore J M, Query C C, Sharp P A. In: The RNA World. Gestleland R F, Atkins J F, editors. Cold Spring Harbor, NY: Cold Spring Harbor Lab. Press; 1993. pp. 303–358.
-
- Berget S M. J Biol Chem. 1995;270:2411–2414. - PubMed
-
- Valcarcel J, Green M R. Trends Biochem Sci. 1996;21:296–301. - PubMed
-
- Zahler A M, Neugebauer K M, Lane W S, Roth M B. Science. 1993;260:219–222. - PubMed
Publication types
MeSH terms
Substances
Grants and funding
LinkOut - more resources
Full Text Sources
Research Materials
