Changes in cell-cycle kinetics during the development and evolution of primate neocortex
- PMID: 9448316
- PMCID: PMC18732
- DOI: 10.1073/pnas.95.3.1242
Changes in cell-cycle kinetics during the development and evolution of primate neocortex
Abstract
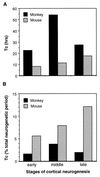
The evolutionary expansion of neocortical size in mammals is particularly prominent in anthropoid primates (i.e., monkeys, apes, and humans) and reflects an increased number of cortical cells, yet the developmental basis for this increase remains undefined. Cortical cell production depends on the length of the cell-division cycle of progenitor cells during neurogenesis, which previously has been measured only in smaller-brained rodents. To investigate whether cortical expansion in primates reflects modification of cell-cycle kinetics, we determined cell-cycle length during neurogenesis in the proliferative cerebral ventricular zone of fetal rhesus monkeys, by using cumulative S-phase labeling with bromodeoxyuridine. Cell-cycle durations in monkeys were as much as 5 times longer than those reported in rodents. Nonetheless, substantially more total rounds of cell division elapsed during the prolonged neurogenetic period of the monkey cortex, providing a basis for increased cell production. Moreover, unlike the progressive slowing that occurs during cortical development in rodents, cell division accelerated during neurogenesis of the enlarged cortical layers in monkeys. These findings suggest that evolutionary modification of the duration and number of progenitor cell divisions contributed to both the expansion and laminar elaboration of the primate neocortex.
Figures


Similar articles
-
S-phase duration is the main target of cell cycle regulation in neural progenitors of developing ferret neocortex.J Comp Neurol. 2016 Feb 15;524(3):456-70. doi: 10.1002/cne.23801. Epub 2015 Jun 3. J Comp Neurol. 2016. PMID: 25963823 Free PMC article.
-
Comparative analysis of the subventricular zone in rat, ferret and macaque: evidence for an outer subventricular zone in rodents.PLoS One. 2012;7(1):e30178. doi: 10.1371/journal.pone.0030178. Epub 2012 Jan 17. PLoS One. 2012. PMID: 22272298 Free PMC article.
-
Computational models of neocortical neuronogenesis and programmed cell death in the developing mouse, monkey, and human.Cereb Cortex. 2007 Oct;17(10):2433-42. doi: 10.1093/cercor/bhl151. Epub 2007 Jan 4. Cereb Cortex. 2007. PMID: 17204816
-
Neurogenesis and the evolution of cortical diversity: mode, tempo, and partitioning during development and persistence in adulthood.Brain Behav Evol. 2000 Jun;55(6):336-44. doi: 10.1159/000006668. Brain Behav Evol. 2000. PMID: 10971018 Review.
-
Neural progenitors, neurogenesis and the evolution of the neocortex.Development. 2014 Jun;141(11):2182-94. doi: 10.1242/dev.090571. Development. 2014. PMID: 24866113 Review.
Cited by
-
Intrinsic gray-matter connectivity of the brain in adults with autism spectrum disorder.Proc Natl Acad Sci U S A. 2013 Aug 6;110(32):13222-7. doi: 10.1073/pnas.1221880110. Epub 2013 Jul 22. Proc Natl Acad Sci U S A. 2013. PMID: 23878213 Free PMC article.
-
Cell cycle activation and aneuploid neurons in Alzheimer's disease.Mol Neurobiol. 2012 Aug;46(1):125-35. doi: 10.1007/s12035-012-8262-0. Epub 2012 Apr 13. Mol Neurobiol. 2012. PMID: 22528601 Review.
-
The Principle of Cortical Development and Evolution.Neurosci Bull. 2024 Jul 18. doi: 10.1007/s12264-024-01259-2. Online ahead of print. Neurosci Bull. 2024. PMID: 39023844 Review.
-
DNA methylation in the human cerebral cortex is dynamically regulated throughout the life span and involves differentiated neurons.PLoS One. 2007 Sep 19;2(9):e895. doi: 10.1371/journal.pone.0000895. PLoS One. 2007. PMID: 17878930 Free PMC article.
-
Formation of cortical fields on a reduced cortical sheet.J Neurosci. 1999 Nov 15;19(22):9939-52. doi: 10.1523/JNEUROSCI.19-22-09939.1999. J Neurosci. 1999. PMID: 10559402 Free PMC article.
References
Publication types
MeSH terms
Substances
LinkOut - more resources
Full Text Sources
Other Literature Sources

