. 1997 Dec 29;139(7):1597-610.
doi: 10.1083/jcb.139.7.1597.

Spatial organization of large-scale chromatin domains in the nucleus: a magnified view of single chromosome territories

Affiliations

Spatial organization of large-scale chromatin domains in the nucleus: a magnified view of single chromosome territories

J Ferreira et al. J Cell Biol. .

Abstract

We have analyzed the spatial organization of large scale chromatin domains in chinese hamster fibroblast, human lymphoid (IM-9), and marsupial kidney epithelial (PtK) cells by labeling DNA at defined stages of S phase via pulsed incorporation of halogenated deoxynucleosides. Most, if not all, chromosomes contribute multiple chromatin domains to both peripheral and internal nucleoplasmic compartments. The peripheral compartment contains predominantly late replicating G/Q bands, whereas early replicating R bands preferentially localize to the internal nucleoplasmic compartment. During mitosis, the labeled chromatin domains that were separated in interphase form a pattern of intercalated bands along the length of each metaphase chromosome. The transition from a banded (mitotic) to a compartmentalized (interphasic) organization of chromatin domains occurs during the late telophase/early G1 stage and is independent of transcriptional activation of the genome. Interestingly, generation of micronuclei with a few chromosomes showed that the spatial separation of early and late replicating chromatin compartments is recapitulated independently of chromosome number, even in micronuclei containing only a single chromosome. Our data strongly support the notion that the compartmentalization of large-scale (band size) chromatin domains seen in the intact nucleus is a magnified image of a similar compartmentalization occurring in individual chromosome territories.


Figures
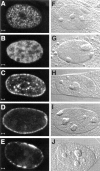
Figure 1
Figure 1
Early and late replicating chromatin distribute in distinct compartments in the nuclei of CCL-39 cells. After synchronous release into S phase, cells were pulse labelled with BrdU immediately before harvesting at hourly intervals. BrdU-DNA was visualized by indirect immunofluorescence. A–E show optical sections through nuclei considered representative of each of the five replication patterns detected (A, pattern 1–E, pattern 5). The corresponding DIC images are depicted in the right row (F–J). Bar, 1 μm.
Figure 2
Figure 2
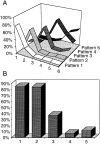
Replication patterns succeed in an ordered sequence throughout S phase. (A) Synchronized cells were released into S phase and pulse labelled with BrdU before harvesting at hourly intervals. Thus, time point 1 refers to cells harvested 1 h after hydroxyurea release. For each time point, a minimum of 200 cells were analyzed. The nuclei were sorted by pattern and the results quantified as percentages of the total number of BrdU- labelled cells. The graph demonstrates an ordered succession of replication patterns as cells progress through S phase with each pattern showing a distinct peak. It is also evident that the overlap between the earlier replication patterns (Patterns 1 and 2) and the later patterns (4 and 5) is minimal, i.e., always <6%. At later time points, no additional clearly defined peaks were observed (not shown). (B) We analyzed ∼50 nuclei per replication pattern randomly selected from an asynchronous cell population pulse labelled with BrdU (10 μM final concentration; 30 min). For each nucleus, the BrdU signal was quantified in equatorial confocal sections (refer to Materials and Methods). Although the internal compartment corresponds to 71.55% of the inner nuclear volume, in an equatorial section it is represented by the inner 80% of the nuclear profile area. Thus, the expected proportion of the BrdU signal in the internal compartment, if its distribution was homogeneous, would equal 0.8. The graph represents the average proportion between the area occupied by the BrdU signal in the inner 80% of the nuclear profile and the total area of the signal in each group. Using ANOVA followed by Scheffe's multicomparison tests, the only statistical identities occur for patterns 1 and 2 (P = 0.999) and for patterns 4 and 5 (P = 0.463). P values for other pairs are <0.0001. All the measured proportions are statistically different from expected for a homogeneous distribution as assessed by Student's t test (P < 0.0001). A significant reduction in the BrdU signal in the nuclear interior is seen as cells progress through S phase.
Figure 3
Figure 3
Analysis of replication labelling patterns in metaphase chromosomes. Metaphase smears were obtained from cells pulsed with BrdU at Stages 1–5 of S phase. BrdU staining and DAPI staining of the same chromosomes is shown side by side. Stage 1 and 2: major R bands show intense BrdU signal (large arrowheads). Stage 3: BrdU signal concentrates in Q bands (large arrowheads). Stage 4: BrdU signal concentrates in Q bands (large arrowheads) that spread along the length of every chromosome as shown in the whole chromosome complement from a single cell (larger panels). Stage 5: BrdU staining is restricted to a few bands per chromosome. Note that a prominent R band from a stage 2 chromosome (small arrowhead) is devoid of BrdU signal and that, in a stage 4 chromosome, an R band region (small arrowhead) is BrdU positive. Bar, 3 μm.
Figure 4
Figure 4
Intercalated banding of early and late replicating DNA sequences in metaphase chromosomes. (A and B) Metaphase spreads were obtained from synchronized cells grown in the presence of iododeoxyuridine (2.5 μM) during the initial 90–100 min of S phase followed by a second pulse with chlorodeoxyuridine (5 μM) starting 4 h after release into S phase until mitosis was reached. Controls showed that ∼90% of the cells had accumulated replication patterns 1 and 2 during the first pulse and that ∼80% had accumulated patterns 4 and 5 during the second pulse. Confocal imaging after differential immunolabelling of IdU-DNA (green) and CldU-DNA (red) shows that the early and late replicating domains intercalate in a banded pattern. (C) Confocal imaging of a metaphase spread obtained from cells labelled with BrdU and that accumulated patterns 4 and 5. The whole chromosome set is shown. Immunostaining of BrdU-DNA was assigned a green pseudocolor that appears yellow in the merged image and total DNA was immunolabeled with an anti–DNA autoimmune antiserum (red). (D–F) To control the specificity of the differential immunolabelling of CldU-DNA- and IdU-DNA-synchronized CHF cells were grown for a full S phase in the presence of CldU (5 μM) and then for a second cell cycle in the presence of IdU (2.5 μM). Metaphase spreads show that IdU-DNA (E) is present in both chromatids of each chromosome, whereas CldU-DNA (D), as expected, is restricted to one chromatid. Red and green confocal images were merged (F) and areas of overlap appear yellow; some sister chromatid exchanges are clearly visible. Bar, 10 μm.
Figure 5
Figure 5
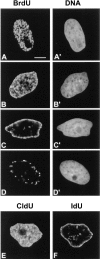
Chromatin replication patterns in PtK cells. PtK cells were pulse labelled with BrdU immediately before harvesting. BrdU incorporation sites were visualized by indirect immunofluorescence (A–D) and total DNA was stained with YOYO (A′– D′). Shown are optical sections through nuclei considered representative of each pattern. (A) Pattern A, (B) pattern B, (C) pattern C, (D) pattern D. The temporal order of replication patterns in PtK cells was established by pulse labelling asynchronous cultures with CldU (5 μM; 30 min) followed 3–5 h later by a second pulse with IdU (2:5 μM; 30 min). In the cell shown (E and F), the two pulses were administered 3 h apart, and a succession from pattern B (E) to pattern C (F) is observed. Bar, 10 μm.
Figure 6
Figure 6
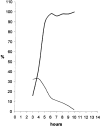
In PtK cells, peripheral chromatin that replicates in the second half of S phase (replication pattern C) is contributed by all chromosomes. Asynchronously growing PtK cells were pulse labelled with BrdU (10 mM; 30 min) and, after release into BrdU-free medium, the cells were harvested at hourly intervals. BrdU-DNA was revealed by indirect immunofluorescence and total DNA by staining with YOYO. For each time point, we scored the percentage of mitotics (prophases) showing “complete” labelling (i.e., BrdU labelling present in all chromosomes) and the percentage of BrdU-labelled interphase cells that displayed pattern C (see text for details). A minimum of 50 mitotic and of 120 interphase cells were analyzed for each time point. The graph shows that during the time period, stage C cells undergo mitosis, as evidenced by the decline in their percentage (thin line), the vast majority of the corresponding mitotic cells (89–100%; thick line) display complete labelling.
Figure 7
Figure 7
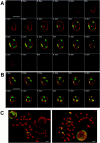
Association of chromosomes with the nuclear periphery. Human lymphoid cells (IM-9 cells) were labelled with BrdU (5 μM) for a full S phase, and then grown in BrdU-free medium for ∼7 d to generate a population with only a few particles labelled. Cells were double immunolabelled for BrdU (green) and lamin B (red) and serial optical sections were obtained by confocal microscopy at 0.4-μM intervals. Complete (A) and partial (B) confocal series are depicted. Note that all labelled particles reach the nuclear periphery. (C) Metaphase spreads were obtained from the same cell population after addition of colcemid to the cultures. Images from total DNA stained with DAPI (red) and BrdU-DNA (yellow) were acquired with a SIT camera and electronically superimposed. Only a few chromosomes show BrdU staining. Bars, 10 μm.
Figure 8
Figure 8
Micronuclei display features typical of active interphase nuclei. The results shown were obtained with CHF cells induced to micronucleate in the presence of colcemid. (A) Transcriptional activity in micronuclei as assessed by incorporation of Br-UTP (refer to Materials and Methods). The sites of transcription are visualized as multiple foci distributed throughout the nucleoplasm as previously shown for intact nuclei (see for example Wansink et al., 1993; Ferreira et al., 1994). The hnRNP A1 protein was immunolocalized in micronuclei with mAb 4B10 (D). Poly (A) RNA as detected by in situ hybridization with a Poly (U) oligoribonucleotide probe in intact nuclei (B) and in micronuclei (E). Micronuclei efficiently incorporate BrdU (10 μM; 30 min) and show replication patterns similar to those seen in whole nuclei (C, pattern 1 and F, pattern 4). Bar, 10 μm.
Figure 9
Figure 9
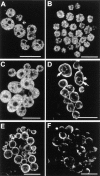
Compartmentalization of DNA is independent of chromosome number. CHF cells pulse labelled with BrdU at defined stages of S phase (stages 1–5) were induced to micronucleate. Each picture shows a single cell. (A and B) Stage 1 micronuclei displaying different extents of micronucleation. (C) Stage 2 micronuclei. (D) Stage 3 micronuclei; in addition to predominant peripheral labelling, there are internal ring-shaped chromatin assemblies in most micronuclei, the more prominent of which are depicted (arrows). (E) Stage 4 micronuclei. (F) Stage 5 micronuclei. Note the striking resemblance to replication patterns seen in intact nuclei. Bar, 10 μm.
Figure 10
Figure 10
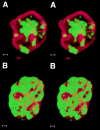
The differential compartmentalization typical of interphase is established during late telophase/G1. BrdU-labelled late replicating DNA was probed with an anti–BrdU mAb (green) and nuclear lamin B with an anti–lamin antiserum (red) during (A) early telophase and (B) late telophase/early G1. In both cases, serial optical sections were taken at 0.33–0.4-mm intervals, digitally converted into 3D images and are shown here as stereo pairs. During early telophase (A), most of the labelled chromatin (green) occupies the internal nucleoplasm; frequent connections are seen with internal projections of lamin staining. In late telophase/early G1 cells (B), most of the late replicating chromatin (green) has relocated to the nuclear periphery. Bar, 1 μm.
Figure 11
Figure 11
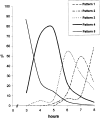
Interphase compartmentalization of DNA is established during late telophase/early G1 in CHF cells. Asynchronous cultures were pulse labelled with BrdU (10 μM; 30 min) and after a 3-h period (similar to the duration of G2 phase), cells were harvested at hourly intervals. Late telophase/early G1 cells were checked for the presence of labelled patterns after immunodetection of BrdU-DNA. For each time point, a minimum of 60 cells were evaluated. The graph shows that each pattern peaks according to a temporal order that is the reverse of that seen during progression through S phase (see text).
Figure 12
Figure 12
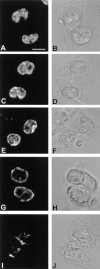
Late telophase/early G1 cells display spatial configurations of BrdU-DNA similar to the replication patterns seen during S phase. Confocal images are shown for cells harvested during the peak of each pattern (refer to Fig. 11). (A) Pattern 1; (C) pattern 2; (E) pattern 3; (G) pattern 4; (I) pattern 5. The corresponding phase contrast images are depicted in the right column (B, D, F, H and J). Bar, 10 μm.

Similar articles

Cited by

References

    1. Agard DA, Sedat JW. Three-dimensional architecture of a polytene nucleus. Nature. 1983;302:676–681. - PubMed
    1. Aten JA, Stap J, Hoebe R, Bakker PJM. Application and detection of IdUrd and CldUrd as two independent cell-cycle markers. Methods Cell Biol. 1994;41:317–326. - PubMed
    1. Belmont AS, Sedat JW, Agard DA. A three-dimensional approach to mitotic chromosome structure: evidence for a complex hierarchical organization. J Cell Biol. 1987;105:77–92. - PMC - PubMed
    1. Belmont AS, Braunfeld MB, Sedat JW, Agard DA. Large-scale chromatin structural domains within mitotic and interphase chromosomes in vivo and in vitro. Chromosoma. 1989;98:129–143. - PubMed
    1. Belmont AS, Zhai Y, Thilenius A. Lamin B distribution and association with peripheral chromatin revealed by optical sectioning and electron microscopy tomography. J Cell Biol. 1993;123:1671–1685. - PMC - PubMed

Publication types