. 1997 Dec;8(12):2365-78.
doi: 10.1091/mbc.8.12.2365.

Organization of G proteins and adenylyl cyclase at the plasma membrane

Affiliations
Free PMC article

Organization of G proteins and adenylyl cyclase at the plasma membrane

C Huang et al. Mol Biol Cell. 1997 Dec.
Free PMC article

Abstract

There is mounting evidence for the organization and compartmentation of signaling molecules at the plasma membrane. We find that hormone-sensitive adenylyl cyclase activity is enriched in a subset of regulatory G protein-containing fractions of the plasma membrane. These subfractions resemble, in low buoyant density, structures of the plasma membrane termed caveolae. Immunofluorescence experiments revealed a punctate pattern of G protein alpha and beta subunits, consistent with concentration of these proteins at distinct sites on the plasma membrane. Partial coincidence of localization of G protein alpha subunits with caveolin (a marker for caveolae) was observed by double immunofluorescence. Results of immunogold electron microscopy suggest that some G protein is associated with invaginated caveolae, but most of the protein resides in irregular structures of the plasma membrane that could not be identified morphologically. Because regulated adenylyl cyclase activity is present in low-density subfractions of plasma membrane from a cell type (S49 lymphoma) that does not express caveolin, this protein is not required for organization of the adenylyl cyclase system. The data suggest that hormone-sensitive adenylyl cyclase systems are localized in a specialized subdomain of the plasma membrane that may optimize the efficiency and fidelity of signal transduction.


Figures

Figure 1
Figure 1
Specificity of antibody preparations. (A) Preparations of purified recombinant G protein α subunits (25 ng) were resolved by SDS-PAGE and analyzed by silver staining or Western immunoblotting. Only the region of the gel where G protein α subunits migrate is shown (7 cm long, 11% polyacrylamide gel). If the film is exposed to the blots for an extended time (not shown), a reaction with αs can be observed with the A569 antibody preparation (but not with B087 or R4). (B) Crude membrane fractions (25 μg protein) were resolved on a 16-cm long, 9% polyacrylamide gel, and immunoblots are shown. Numbers at left indicate the position of prestained molecular mass standards in kilodaltons. The crude membrane preparations are from MDCK (vector control cells, lanes 1), MA104 (lanes 2), or fibroblasts (lanes 3). The α subunit reactivities of the antibodies are indicated in parentheses near the top of the panel. A569 detects only αi in cell membranes because it reacts better with αi than αs and there is approximately 10-fold more αi than αs in most cells (and there is little or no αo expressed in these cells). Mab R4 is specific for αi1 (X. Li et al., 1995). Monoclonal antibody R4 does not react well for immunoblotting and is not sensitive enough, by this method, to detect αi1 in MDCK cells or fibroblasts; only MA104 membranes are shown for this antibody. The polyclonal caveolin antibody preparation reacts primarily with one protein band but also with other minor isoforms of caveolin in the 21–25 kDa region of the blot. Please note that the 40-kDa band labeled αi (to the right of lane 3 of the caveolin blot, panel B) is residual signal remaining from a previous incubation of the blot with the αi reactive A569 antibody preparation and is not from reactivity with the caveolin antibodies. Antibodies for Western immunoblotting were as follows: affinity-purified A569 and B087 at 100 ng/ml, the purified polyclonal caveolin antibodies at 500 ng/ml, culture medium from monoclonal antibody R4-producing cells diluted 1:25 (vol/vol).
Figure 2
Figure 2
Immunofluorescence of plasma membranes performed with antibodies specific for G protein subunits. En face views of the inner side of plasma membrane fragments were obtained by sonicating MA104 cells adherent to coverslips. Oregon green-conjugated secondary antibodies were used to visualize primary antibodies to detect: (A) αi subunits with B087 antibodies (10 μg/ml) or (B) β subunits with T20 antibodies (1 μg/ml). The larger areas of the photographs that are devoid of fluorescent signal represent spaces where plasma membrane fragments are absent. Scale bar, 2 μm.
Figure 3
Figure 3
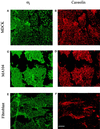
Double immunofluorescence of plasma membranes performed with antibodies specific for αi and caveolin. Plasma membranes similar to those in Figure 2 were prepared from MDCK cells (A and B), MA104 cells (C and D), and fibroblasts (E and F). Oregon green-conjugated secondary antibodies were used to visualize αi in the lefthand panels and Texas red-conjugated antibodies were used to detect caveolin in the righthand panels. The spillover of signal between the two fluorophores was insignificant (determined by single immunofluorescence, not shown). Affinity-purified B087 (10 μg/ml) was used for panels A and C, R4 (1:100 dilution of culture medium from antibody-producing cells) for panel E, caveolin monoclonal antibody (5 μg/ml) for B and D, and affinity-purified polyclonal antibody (10 μg/ml) for panel F. Scale bar, 4 μm.
Figure 4
Figure 4
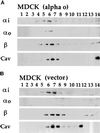
Fractionation of endogenous and ectopically expressed G proteins and caveolin from TX-100 extracts of MDCK epithelial cells. Stably transfected MDCK cells that ectopically express αo (panel A) were compared with G418-resistant control cells that had been stably transfected with the empty vector (panel B). Four milliliters of detergent extract, adjusted to 40% sucrose, was loaded at the bottom of a tube followed by a 7-ml linear gradient of 30–5% sucrose. After centrifugation, 0.8-ml fractions were collected from the top of the gradients, half of which was acetone-precipitated and analyzed by Western immunoblotting. Most of the cellular protein (assayed by Ponceau S staining of the blots, not shown) remains below the gradient in the five bottom fractions (numbered 10–14). Ectopically expressed αo (A) consistently comigrates with endogenous αi, β, and caveolin (cav) in detergent-resistant, low-density fractions centered around fraction 6 (A and B). αi was detected by B087 antiserum (1:10,000 dilution), β by B600 antiserum (1:10,000), αo by culture medium from Mab 2A-producing cells (1:500), and caveolin (cav) by the purified polyclonal antibodies (30 ng/ml). Not shown are results for αs, which comigrates with the other G protein subunits from MDCK and MA104 cells.
Figure 5
Figure 5
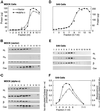
OptiPrep gradient fractionation of detergent-free plasma membranes from MDCK epithelial or S49 lymphoma cells. Sonicated plasma membranes were brought to 23% OptiPrep in 4 ml and were placed at the bottom of the tube. A linear gradient of 20–10% OptiPrep was poured on top of the plasma membranes. After centrifugation, either 1 ml (panels A, B, C, and F) or 0.7-ml fractions (panels D and E) were taken from the top of the tube. These fractions were analyzed for total protein content by Bradford assay (panels A and D), G protein or caveolin content by Western immunoblotting (panels B, C, and E), or adenylyl cyclase activity (panel F). The specific activity of isoproterenol- (Iso-) and forskolin- (Fsk-) stimulated adenylyl cyclase in the individual fractions 1–6 and combined fractions 7–11 are shown in panel F. Antibody preparations utilized for immunoblotting were the same concentration as Figure 4 but, in addition, 584 antiserum was employed for detection of long and short isoforms of αs at a dilution of 1:5,000.
Figure 6
Figure 6
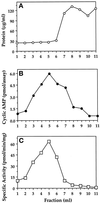
Adenylyl cyclase activity in OptiPrep gradient fractions prepared from fibroblasts. Plasma membranes were fractionated similarly to those shown in Figure 5. (A) Protein content of each 1-ml fraction. (B) cAMP produced in an assay tube containing 120 μl of gradient fraction incubated with 25 μM forskolin. (C) Specific activity of forskolin-stimulated adenylyl cyclase.
Figure 7
Figure 7
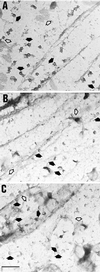
Immunogold labeling of plasma membranes with caveolin or αi antibodies. Electron micrographs show en face views of the inner side of plasma membrane fragments that have been torn from the upper surface of cultured fibroblasts. The location of some of the morphologically identifiable caveolae (full or partial doughnut shapes indicated by closed arrows) and coated pits (flat or curved honeycomb patterns indicated by open arrows) are shown. (A) Caveolae are decorated well by gold particles when the polyclonal (panel A, 1 μg/ml) or monoclonal (not shown) caveolin antibodies are utilized. (B) Morphologically identifiable caveolae are infrequently labeled by αi reactive B087 antibodies (10 μg/ml) or (C) A569 antibodies (10 μg/ml). The letters at the upper left corner of each panel are placed over a small area that is devoid of plasma membrane or gold particles. Scale bar, 0.5 μm.
Figure 8
Figure 8
Assay for interaction between G protein subunits and the amino-terminal domain of caveolin. (A) Purified GST (upper panel) or GST-NT-caveolin containing caveolin:CH6 residues 1–101 (lower panel) immobilized on glutathione agarose beads (3500 pmol) was incubated with purified myristoylated αo (410 pmol), bovine brain βγ (580 pmol), or αoβγ heterotrimer (410 pmol) as indicated at the top of the figure. After allowing the proteins to interact overnight, the resin was washed six times, and bound GST and any associated proteins were eluted with 25 mM reduced glutathione. Equal portions of the load samples (L), protein that did not bind the affinity resin and was present in the flow through (FT), the first wash (W1), the last wash (W6), and glutathione eluates (E) were analyzed for the presence of G protein subunits by immunoblotting with specific G protein α and/or β antisera. Film was exposed to the blot for 2 min. (B) Samples from glutathione eluates from each binding condition described above were analyzed side-by-side for comparison and analyzed for the presence of G protein subunits by immunoblotting. Film was exposed to immunoblots for either 2 min or, to maximize detection of the chemiluminescence signals, for 15 h. There is a hint of signal for αo perceptible in the GST NT-caveolin eluate only after prolonged exposure of the blot to film. This signal represents an extremely small portion of that which was loaded on the resin. An ink dot was placed to the right of each of three bands detected after the 15-h exposure: two bands corresponding to β (one each for GST and GST-NT-caveolin:CH6 elutions) and one for αo in the elution from GST NT-caveolin:CH6.
Figure 9
Figure 9
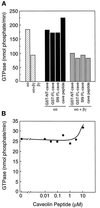
Failure of purified full-length caveolin or caveolin derivatives to alter steady-state GTPase activity of αo or Go heterotrimer. (A) The steady state GTPase activity of purified myristoylated αo (3 nM), myristoylated Go heterotrimer (αo + βγ, 3 nM each), or βγ (3 nM) was measured (hatched bars). The relative capacities of purified GST fusion protein containing residues 1–101 of caveolin:CH6 (GST-NT-cave; 1 μM), purified full-length caveolin:CH6 fused to GST (GST-FL-cave; 1 μM), full-length NH6:caveolin purified from Sf9 cells (Sf9-FL-cave; 1 μM), or a peptide corresponding to residues 82–101 of caveolin (cave peptide; 10 μM) to alter the steady-state GTPase activity of myristoylated αo (black bars) or Go heterotrimer (gray bars, αo + βγ) were assayed but were found to be negligible. (B) The effects of increasing concentrations of caveolin peptide (residues 82–101) on the steady-state GTP hydrolysis of myristoylated αo (0.6 nM) were assayed but were also found to be negligible.

Similar articles

Cited by

References

    1. Anderson RGW, Kamen BA, Rothberg KG, Lacey SW. Potocytosis: sequestration and transport of small molecules by caveolae. Science. 1992;255:410–411. - PubMed
    1. Anderson RGW. Caveolae: where incoming and outgoing messengers meet. Proc Natl Acad Sci USA. 1993;90:10909–10913. - PMC - PubMed
    1. Anderson, R.G.W. (1998). The caveolae membrane system. Annu. Rev. Biochem. (in press). - PubMed
    1. Brewer CB. Cytomegalovirus plasmid vectors for permanent lines of polarized epithelial cells. Methods Cell Biol. 1994;43:233–245. - PubMed
    1. Casey PJ, Fong HKW, Simon MI, Gilman AG. Gz, a guanine nucleotide-binding protein with unique biochemical properties. J Biol Chem. 1990;265:2383–2390. - PubMed

Publication types

MeSH terms

LinkOut - more resources