Phenotypic and functional separation of memory and effector human CD8+ T cells
- PMID: 9348298
- PMCID: PMC2199103
- DOI: 10.1084/jem.186.9.1407
Phenotypic and functional separation of memory and effector human CD8+ T cells
Abstract
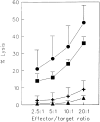
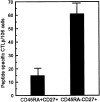
Human CD8+ memory- and effector-type T cells are poorly defined. We show here that, next to a naive compartment, two discrete primed subpopulations can be found within the circulating human CD8+ T cell subset. First, CD45RA-CD45R0(+) cells are reminiscent of memory-type T cells in that they express elevated levels of CD95 (Fas) and the integrin family members CD11a, CD18, CD29, CD49d, and CD49e, compared to naive CD8+ T cells, and are able to secrete not only interleukin (IL) 2 but also interferon gamma, tumor necrosis factor alpha, and IL-4. This subset does not exert cytolytic activity without prior in vitro stimulation but does contain virus-specific cytotoxic T lymphocyte (CTL) precursors. A second primed population is characterized by CD45RA expression with concomitant absence of expression of the costimulatory molecules CD27 and CD28. The CD8+CD45RA+CD27- population contains T cells expressing high levels of CD11a, CD11b, CD18, and CD49d, whereas CD62L (L-selectin) is not expressed. These T cells do not secrete IL-2 or -4 but can produce IFN-gamma and TNF-alpha. In accordance with this finding, cells contained within this subpopulation depend for proliferation on exogenous growth factors such as IL-2 and -15. Interestingly, CD8+CD45RA+CD27- cells parallel effector CTLs, as they abundantly express Fas-ligand mRNA, contain perforin and granzyme B, and have high cytolytic activity without in vitro prestimulation. Based on both phenotypic and functional properties, we conclude that memory- and effector-type T cells can be separated as distinct entities within the human CD8+ T cell subset.
Figures


Similar articles
-
Differentiation of human CD8(+) T cells from a memory to memory/effector phenotype.J Immunol. 2002 Jun 1;168(11):5538-50. doi: 10.4049/jimmunol.168.11.5538. J Immunol. 2002. PMID: 12023349
-
CD45RA(bright)/CD11a(bright) CD8+ T cells: effector T cells.Int Immunol. 1998 Dec;10(12):1837-45. doi: 10.1093/intimm/10.12.1837. Int Immunol. 1998. PMID: 9885904
-
Cytolytic mechanisms and expression of activation-regulating receptors on effector-type CD8+CD45RA+CD27- human T cells.J Immunol. 2000 Aug 15;165(4):1910-7. doi: 10.4049/jimmunol.165.4.1910. J Immunol. 2000. PMID: 10925272
-
Increased expression of NK cell markers on T lymphocytes in aging and chronic activation of the immune system reflects the accumulation of effector/senescent T cells.Mech Ageing Dev. 2000 Dec 20;121(1-3):77-88. doi: 10.1016/s0047-6374(00)00199-8. Mech Ageing Dev. 2000. PMID: 11164462 Review.
-
Expression of CD11a and CD45R isoforms defines distinct subsets of CD8+ TCR alpha beta and TCR gamma delta CTL in vivo.Immunol Rev. 1995 Aug;146:82-94. doi: 10.1111/j.1600-065x.1995.tb00685.x. Immunol Rev. 1995. PMID: 7493762 Review.
Cited by
-
15 kDa granulysin causes differentiation of monocytes to dendritic cells but lacks cytotoxic activity.J Immunol. 2012 Jun 15;188(12):6119-26. doi: 10.4049/jimmunol.1200570. Epub 2012 May 14. J Immunol. 2012. PMID: 22586033 Free PMC article.
-
Tissue-resident mucosal-associated invariant T (MAIT) cells in the human kidney represent a functionally distinct subset.Eur J Immunol. 2020 Nov;50(11):1783-1797. doi: 10.1002/eji.202048644. Epub 2020 Aug 6. Eur J Immunol. 2020. PMID: 32652598 Free PMC article.
-
Third-Party BK Virus-Specific Cytotoxic T Lymphocyte Therapy for Hemorrhagic Cystitis Following Allotransplantation.J Clin Oncol. 2021 Aug 20;39(24):2710-2719. doi: 10.1200/JCO.20.02608. Epub 2021 Apr 30. J Clin Oncol. 2021. PMID: 33929874 Free PMC article. Clinical Trial.
-
Memory CD8+ T cell differentiation.Ann N Y Acad Sci. 2010 Jan;1183:251-66. doi: 10.1111/j.1749-6632.2009.05126.x. Ann N Y Acad Sci. 2010. PMID: 20146720 Free PMC article. Review.
-
Telomere fluorescence measurements in granulocytes and T lymphocyte subsets point to a high turnover of hematopoietic stem cells and memory T cells in early childhood.J Exp Med. 1999 Jul 19;190(2):157-67. doi: 10.1084/jem.190.2.157. J Exp Med. 1999. PMID: 10432279 Free PMC article.
References
-
- Merkenschlager M, Terry L, Edwards R, Beverley PC. Limiting dilution analysis of proliferative responses in human lymphocyte populations defined by the monoclonal antibody UCHL1: implications for differential CD45 expression in T cell memory formation. Eur J Immunol. 1988;18:1653–1661. - PubMed
-
- Byrne JA, Butler JL, Cooper MD. Differential activation requirements for virgin and memory T cells. J Immunol. 1988;141:3249–3257. - PubMed
-
- Sanders ME, Makgoba MW, June CH, Young HA, Shaw S. Enhanced responsiveness of human memory T cells to CD2 and CD3 receptor-mediated activation. Eur J Immunol. 1989;19:803–808. - PubMed
-
- Picker LJ, Singh MK, Zdraveski Z, Treer JR, Waldrop SL, Bergstresser PR, Maino VC. Direct demonstration of cytokine synthesis heterogeneity among human memory/effector T cells by flow cytometry. Blood. 1995;86:1408–1419. - PubMed
-
- Sanders ME, Makgoba MW, Sharrow SO, Stephany D, Springer TA, Young HA, Shaw S. Human memory T lymphocytes express increased levels of three cell adhesion molecules (LFA-3, CD2, and LFA-1) and three other molecules (UCHL-1, CDw29, and Pgp-1) and have enhanced IFN-γ production. J Immunol. 1988;140:1401–1407. - PubMed
Publication types
MeSH terms
Substances
LinkOut - more resources
Full Text Sources
Other Literature Sources
Research Materials
Miscellaneous

