Maintenance of calcium homeostasis in the endoplasmic reticulum by Bcl-2
- PMID: 9298978
- PMCID: PMC2132547
- DOI: 10.1083/jcb.138.6.1219
Maintenance of calcium homeostasis in the endoplasmic reticulum by Bcl-2
Abstract
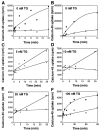
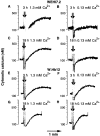
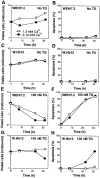
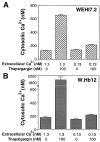
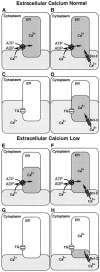
The oncogene bcl-2 encodes a 26-kD protein localized to intracellular membranes, including the ER, mitochondria, and perinuclear membrane, but its mechanism of action is unknown. We have been investigating the hypothesis that Bcl-2 regulates the movement of calcium ions (Ca2+) through the ER membrane. Earlier findings in this laboratory indicated that Bcl-2 reduces Ca2+ efflux from the ER lumen in WEHI7.2 lymphoma cells treated with the Ca2+-ATPase inhibitor thapsigargin (TG) but does not prevent capacitative entry of extracellular calcium. In this report, we show that sustained elevation of cytosolic Ca2+ due to capacitative entry is not required for induction of apoptosis by TG, suggesting that ER calcium pool depletion may trigger apoptosis. Bcl-2 overexpression maintains Ca2+ uptake in the ER of TG-treated cells and prevents a TG-imposed delay in intralumenal processing of the endogenous glycoprotein cathepsin D. Also, Bcl-2 overexpression preserves the ER Ca2+ pool in untreated cells when extracellular Ca2+ is low. However, low extracellular Ca2+ reduces the antiapoptotic action of Bcl-2, suggesting that cytosolic Ca2+ elevation due to capacitative entry may be required for optimal ER pool filling and apoptosis inhibition by Bcl-2. In summary, the findings suggest that Bcl-2 maintains Ca2+ homeostasis within the ER, thereby inhibiting apoptosis induction by TG.
Figures


Similar articles
-
Evidence that BCL-2 represses apoptosis by regulating endoplasmic reticulum-associated Ca2+ fluxes.Proc Natl Acad Sci U S A. 1994 Jul 5;91(14):6569-73. doi: 10.1073/pnas.91.14.6569. Proc Natl Acad Sci U S A. 1994. PMID: 8022822 Free PMC article.
-
Bcl-2 inhibits hydrogen peroxide-induced ER Ca2+ pool depletion.Oncogene. 1996 May 16;12(10):2051-5. Oncogene. 1996. PMID: 8668330
-
Bcl-2 acts subsequent to and independent of Ca2+ fluxes to inhibit apoptosis in thapsigargin- and glucocorticoid-treated mouse lymphoma cells.Cell Calcium. 1996 Jun;19(6):473-83. doi: 10.1016/s0143-4160(96)90056-1. Cell Calcium. 1996. PMID: 8842514
-
Bcl-2 and Ca2+ homeostasis in the endoplasmic reticulum.Cell Death Differ. 2006 Aug;13(8):1409-18. doi: 10.1038/sj.cdd.4401960. Epub 2006 May 26. Cell Death Differ. 2006. PMID: 16729032 Review.
-
Bcl-2 family in inter-organelle modulation of calcium signaling; roles in bioenergetics and cell survival.J Bioenerg Biomembr. 2014 Feb;46(1):1-15. doi: 10.1007/s10863-013-9527-7. J Bioenerg Biomembr. 2014. PMID: 24078116 Free PMC article. Review.
Cited by
-
Dysregulation of cellular membrane homeostasis as a crucial modulator of cancer risk.FEBS J. 2024 Apr;291(7):1299-1352. doi: 10.1111/febs.16665. Epub 2022 Nov 7. FEBS J. 2024. PMID: 36282100 Review.
-
Bcl-X(L) affects Ca(2+) homeostasis by altering expression of inositol 1,4,5-trisphosphate receptors.Proc Natl Acad Sci U S A. 2002 Jul 23;99(15):9830-5. doi: 10.1073/pnas.152571899. Epub 2002 Jul 12. Proc Natl Acad Sci U S A. 2002. PMID: 12118121 Free PMC article.
-
Bcl-2 decreases the free Ca2+ concentration within the endoplasmic reticulum.Proc Natl Acad Sci U S A. 2000 May 23;97(11):5723-8. doi: 10.1073/pnas.97.11.5723. Proc Natl Acad Sci U S A. 2000. PMID: 10823933 Free PMC article.
-
The Ca2+ concentration of the endoplasmic reticulum is a key determinant of ceramide-induced apoptosis: significance for the molecular mechanism of Bcl-2 action.EMBO J. 2001 Jun 1;20(11):2690-701. doi: 10.1093/emboj/20.11.2690. EMBO J. 2001. PMID: 11387204 Free PMC article.
-
The selective BH4-domain biology of Bcl-2-family members: IP3Rs and beyond.Cell Mol Life Sci. 2013 Apr;70(7):1171-83. doi: 10.1007/s00018-012-1118-y. Epub 2012 Sep 6. Cell Mol Life Sci. 2013. PMID: 22955373 Free PMC article. Review.
References
-
- Baffy G, Miyashita T, Williamson JR, Reed JC. Apoptosis induced by withdrawal of interleukin-3 (IL-3) from an IL-3-dependent hematopoietic cell line is associated with repartitioning of intracellular calcium and is blocked by enforced Bcl-2 oncoprotein production. J Biol Chem. 1993;268:6511–6519. - PubMed
-
- Bian X, Hughes FM, Huang Y, Cidlowski JA, Putney JW. Roles of cytoplasmic Ca2+ and intracellular Ca2+stores in induction and suppression of apoptosis in S49 cells. Am J Physiol. 1997;272:C1241–C1249. - PubMed
-
- Booth C, Koch GLE. Perturbation of cellular calcium induces secretion of luminal ER proteins. Cell. 1989;59:729–737. - PubMed
-
- Brostrom CO, Brostrom MA. Calcium-dependent regulation of protein synthesis in intact mammalian cells. Annu Rev Physiol. 1990;52:577–590. - PubMed
MeSH terms
Substances
LinkOut - more resources
Full Text Sources
Other Literature Sources
Miscellaneous

