. 1997 Aug 11;138(3):547-57.
doi: 10.1083/jcb.138.3.547.

Regulation of calreticulin gene expression by calcium

Affiliations

Regulation of calreticulin gene expression by calcium

M Waser et al. J Cell Biol. .

Abstract

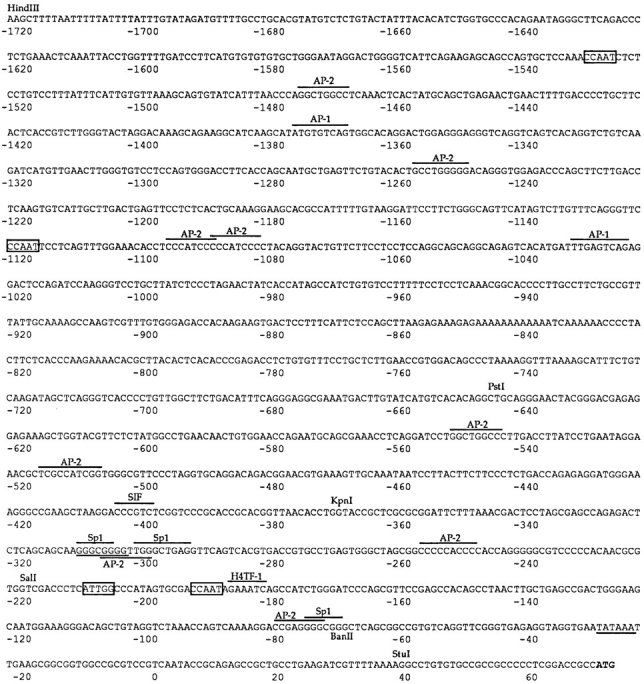
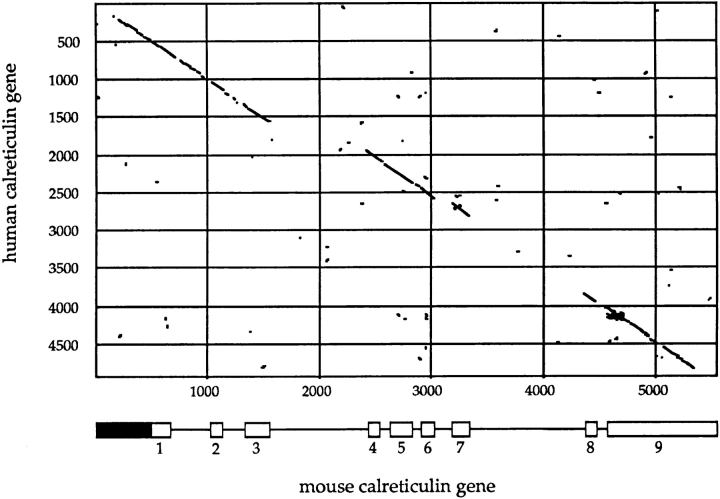
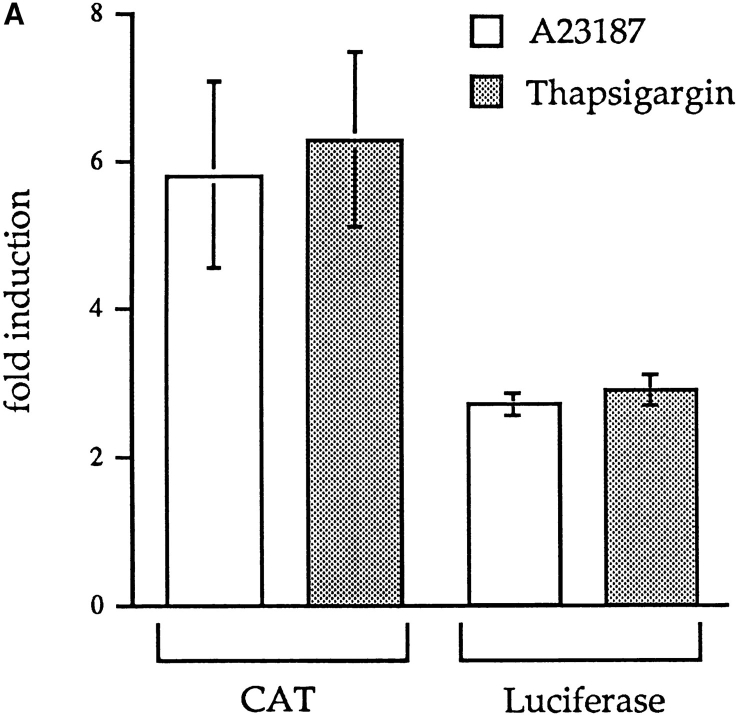
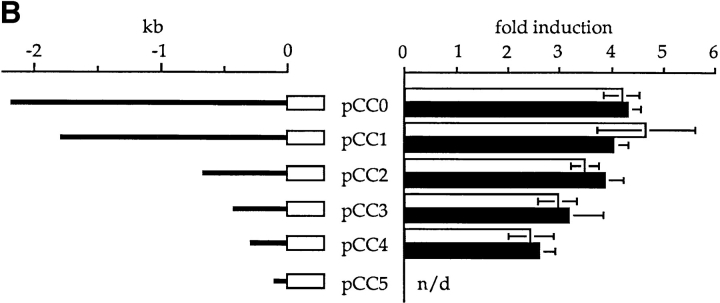
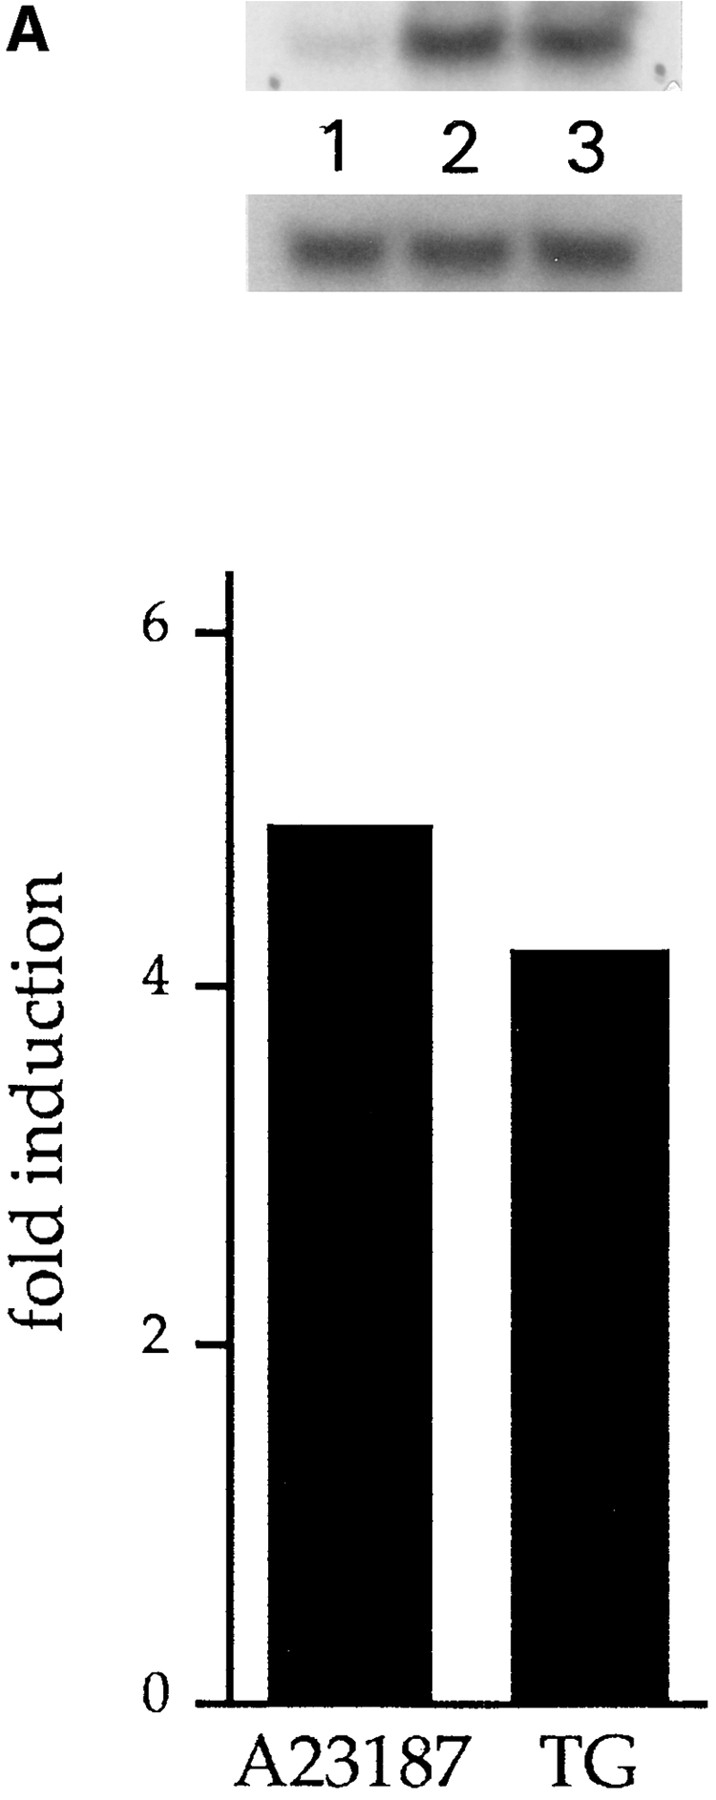
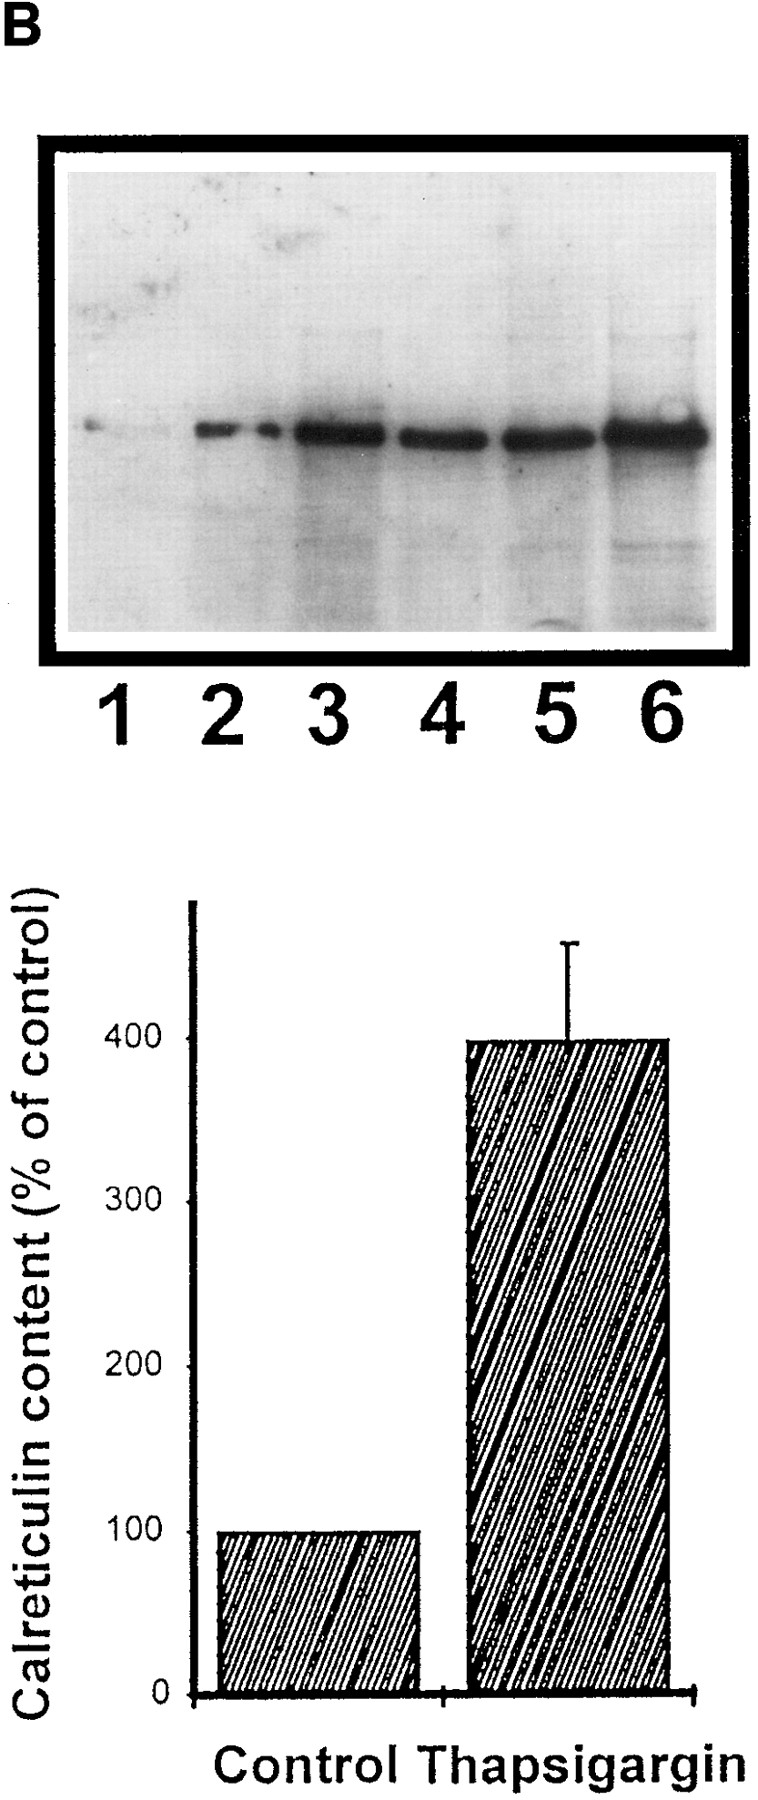
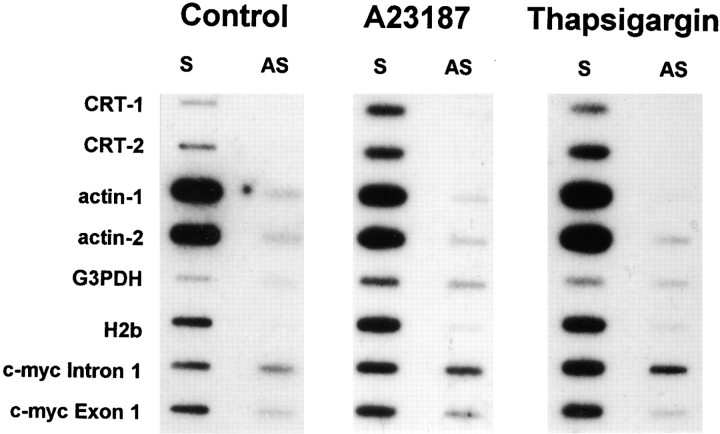
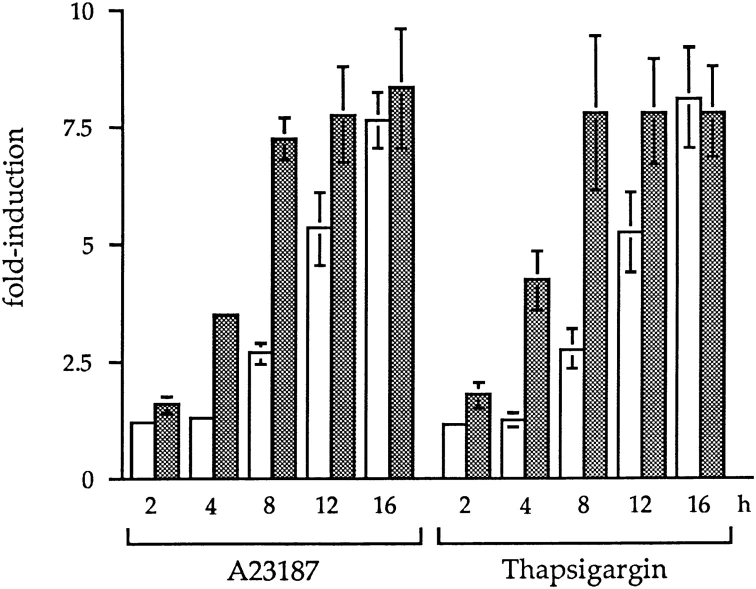
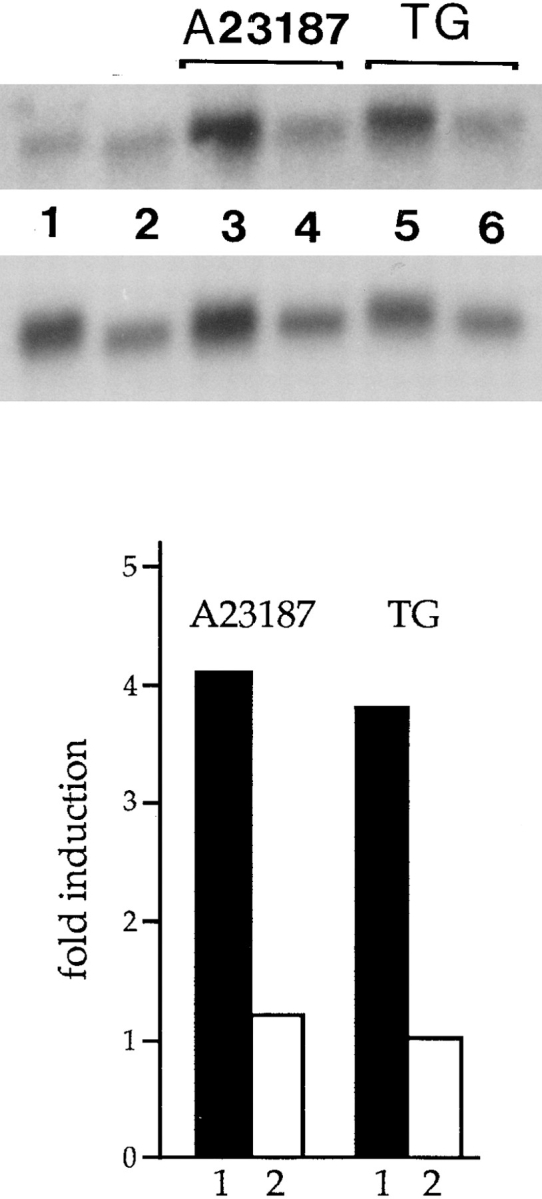
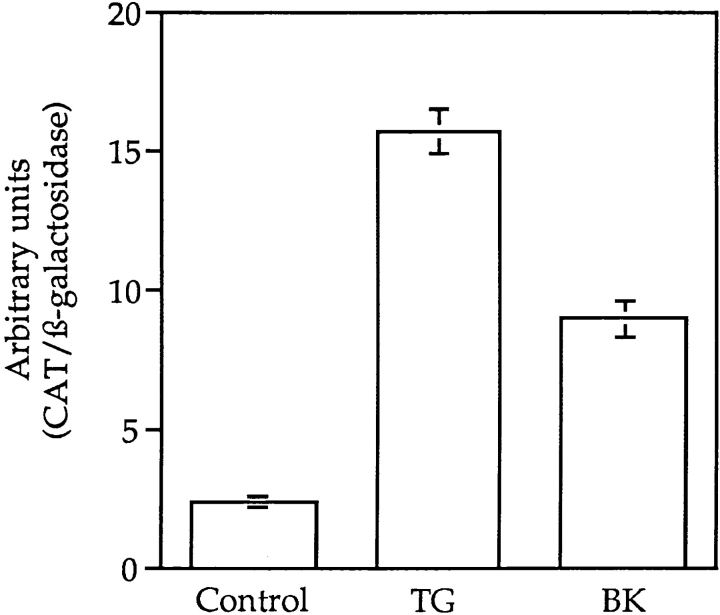
We have isolated and characterized a 12-kb mouse genomic DNA fragment containing the entire calreticulin gene and 2.14 kb of the promoter region. The mouse calreticulin gene consists of nine exons and eight introns, and it spans 4.2 kb of genomic DNA. A 1.8-kb fragment of the calreticulin promoter was subcloned into a reporter gene plasmid containing chloramphenicol acetyltransferase. This construct was then used in transient and stable transfection of NIH/ 3T3 cells. Treatment of transfected cells either with the Ca2+ ionophore A23187, or with the ER Ca2+-ATPase inhibitor thapsigargin, resulted in a five- to sevenfold increase of the expression of chloramphenicol acetyltransferase protein. Transactivation of the calreticulin promoter was also increased by fourfold in NIH/3T3 cells treated with bradykinin, a hormone that induces Ca2+ release from the intracellular Ca2+ stores. Analysis of the promoter deletion constructs revealed that A23187- and thapsigargin-responsive regions are confined to two regions (-115 to -260 and -685 to -1,763) in the calreticulin promoter that contain the CCAAT nucleotide sequences. Northern blot analysis of cells treated with A23187, or with thapsigargin, revealed a fivefold increase in calreticulin mRNA levels. Thapsigargin also induced a fourfold increase in calreticulun protein levels. Importantly, we show by nuclear run-on transcription analysis that calreticulin gene transcription is increased in NIH/3T3 cells treated with A23187 and thapsigargin in vivo. This increase in gene expression required over 4 h of continuous incubation with the drugs and was also sensitive to treatment with cycloheximide, suggesting that it is dependent on protein synthesis. Changes in the concentration of extracellular and cytoplasmic Ca2+ did not affect the increased expression of the calreticulin gene. These studies suggest that stress response to the depletion of intracellular Ca2+ stores induces expression of the calreticulin gene in vitro and in vivo.


Figures

Figure 1
Figure 1
The nucleotide sequence of the promoter region of the mouse calreticulin gene. The nucleotides are numbered with the putative transcriptional initiation site of the mouse calreticulin gene at +1 (Smith and Koch, 1989). (Horizontal lines) Putative binding sites for the DNA binding proteins: AP-2, Sp1, AP-1 and H4TF-1, and SIF. CCAAT sites (boxed). TATA box (underlined). ATG initiation codon (bold). These sequence data are available from GenBank/EMBL/DDBJ under accession number U38249.
Figure 2
Figure 2
DNA dot matrix comparison of the mouse and the human calreticulin gene. DNA dot matrix analysis was carried out using MacVector v4.5 software with the following settings: windows size 30, minimum score 65%, and hash value 6. The nucleotide sequence −526 to +5,023 of the mouse gene was compared with nucleotide sequence −529 to +4,418 of the human gene. (Bottom) The intron–exon configuration of the mouse calreticulin gene. (Empty boxes) Exons, numbered from 1 to 9. (Filled box) The 526-bp promoter region of the mouse gene.
Figure 3
Figure 3
Activation of the calreticulin promoter by A23187 and thapsigargin treatment. (A) NIH/3T3 were stably transfected with either pCC1 or pLC1 and pSVLβ-galactosidase as described in Materials and Methods. Cells were incubated for 16 h with 7 μM A23187, 100 nM thapsigargin, or an appropriate volume of DMSO (control cells), as described in Materials and Methods. (B) Different fragments of the calreticulin promoter were subcloned into the promoterless reporter plasmids pCATbasic (CAT expression vector) as described in Materials and Methods. Vectors pCC0, pCC1, pCC2, pCC3, pCC4, and pCC5 contained the 2,142-, 1,763-, 685-, 415-, 260-, and 115-bp DNA fragments of the calreticulin promoter, respectively. NIH/3T3 were transiently transfected with different pCC vectors and pSVLβ-galactosidase as described in Materials and Methods. Cells were incubated for 16 h with 7 μM A23187 (open bars) or 300 nM thapsigargin (filled bars) and lysed, and reporter enzyme assays were carried out. n/d, not detectable. Data shown are means ± SD of four separate experiments performed in triplicate.
Figure 3
Figure 3
Activation of the calreticulin promoter by A23187 and thapsigargin treatment. (A) NIH/3T3 were stably transfected with either pCC1 or pLC1 and pSVLβ-galactosidase as described in Materials and Methods. Cells were incubated for 16 h with 7 μM A23187, 100 nM thapsigargin, or an appropriate volume of DMSO (control cells), as described in Materials and Methods. (B) Different fragments of the calreticulin promoter were subcloned into the promoterless reporter plasmids pCATbasic (CAT expression vector) as described in Materials and Methods. Vectors pCC0, pCC1, pCC2, pCC3, pCC4, and pCC5 contained the 2,142-, 1,763-, 685-, 415-, 260-, and 115-bp DNA fragments of the calreticulin promoter, respectively. NIH/3T3 were transiently transfected with different pCC vectors and pSVLβ-galactosidase as described in Materials and Methods. Cells were incubated for 16 h with 7 μM A23187 (open bars) or 300 nM thapsigargin (filled bars) and lysed, and reporter enzyme assays were carried out. n/d, not detectable. Data shown are means ± SD of four separate experiments performed in triplicate.
Figure 4
Figure 4
A23187- and thapsigargin-dependent increase in calreticulin mRNA levels (A) and protein levels (B). (A) Nontransfected NIH/3T3 cells were incubated for 16 h with 7 μM A23187, 100 nM thapsigargin, or DMSO. Total RNA was then isolated and electrophoretically separated on a formaldehyde-agarose gel, blotted onto Hybond N nylon membrane, and hybridized with cDNA probes encoding mouse calreticulin and G3PDH, as described in Materials and Methods. (Top) Autoradiogram of a Northern blot probed with calreticulin and G3PDH cDNA. (Lane 1) Control cells; (lane 2) A23187-treated cells; (lane 3) thapsigargin-treated cells. (Bottom) The abundance of calreticulin mRNA (calreticulin mRNA/G3PDH mRNA ratio) was determined using Phosphorimager analysis of Northern blots. (B) NIH/3T3 cells were incubated for 16 h with 100 nM thapsigargin and cellular extracts were prepared as described by Mery et al. (1996). The proteins were separated by SDS-PAGE, transferred electrophoretically to nitrocellulose membranes, and incubated with goat anti-calreticulin antibody as described by Milner et al. (1991). For each condition, three different amounts of cells were analyzed (lanes 1 and 4, 30,000 cells per well; lanes 2 and 5, 100,000 cells per well; lanes 3 and 6, 150,000 cells per well), and the immunoblots were scanned by densitometry. (Top, lanes 1, 2, and 3) Control, untreated cells; (lanes 4, 5, and 6) thapsigargin-treated cells. (Bottom) The slope of the cell number as a function of OD was obtained by a linear fit to give a relative cellular content of calreticulin (Mery et al., 1996). TG, thapsigargin.
Figure 4
Figure 4
A23187- and thapsigargin-dependent increase in calreticulin mRNA levels (A) and protein levels (B). (A) Nontransfected NIH/3T3 cells were incubated for 16 h with 7 μM A23187, 100 nM thapsigargin, or DMSO. Total RNA was then isolated and electrophoretically separated on a formaldehyde-agarose gel, blotted onto Hybond N nylon membrane, and hybridized with cDNA probes encoding mouse calreticulin and G3PDH, as described in Materials and Methods. (Top) Autoradiogram of a Northern blot probed with calreticulin and G3PDH cDNA. (Lane 1) Control cells; (lane 2) A23187-treated cells; (lane 3) thapsigargin-treated cells. (Bottom) The abundance of calreticulin mRNA (calreticulin mRNA/G3PDH mRNA ratio) was determined using Phosphorimager analysis of Northern blots. (B) NIH/3T3 cells were incubated for 16 h with 100 nM thapsigargin and cellular extracts were prepared as described by Mery et al. (1996). The proteins were separated by SDS-PAGE, transferred electrophoretically to nitrocellulose membranes, and incubated with goat anti-calreticulin antibody as described by Milner et al. (1991). For each condition, three different amounts of cells were analyzed (lanes 1 and 4, 30,000 cells per well; lanes 2 and 5, 100,000 cells per well; lanes 3 and 6, 150,000 cells per well), and the immunoblots were scanned by densitometry. (Top, lanes 1, 2, and 3) Control, untreated cells; (lanes 4, 5, and 6) thapsigargin-treated cells. (Bottom) The slope of the cell number as a function of OD was obtained by a linear fit to give a relative cellular content of calreticulin (Mery et al., 1996). TG, thapsigargin.
Figure 5
Figure 5
Nuclear run-on analysis of the calreticulin gene in NIH/ 3T3 cells. Nuclei were isolated from cells treated for 4 h with DMSO (Control), 10 μM A23187 (A23187), or 100 nM thapsigargin (Thapsigargin), and transcription was allowed to proceed in the presence of [32P]UTP as described in Materials and Methods. RNA products from equal numbers of nuclei per sample were hybridized to immobilized single-stranded DNA probes that detect sense (S) or antisense (AS) transcript arising from calreticulin, actin, G3PDH, H2b, and c-myc genes. CRT-1, calreticulin 5″ probe; CRT-2, calreticulin 3″ probe; actin-1, γ-actin 3″ probe; actin-2, γ-actin 5″ probe.
Figure 6
Figure 6
The kinetics of activation of the calreticulin promoter by A23187 and thapsigargin treatment. NCB1 cells (stably expressing CAT under control of the calreticulin promoter and β-galactosidase) were incubated with 7 μM A23187, 100 nM thapsigargin, or DMSO (control cells) for the times indicated. At different time points, cells were either harvested (open bars) or washed with PBS and then incubated in drug-free media to a total of 16 h of incubation (cross-hatched bars). CAT protein levels and β-galactosidase activity were measured as described in Materials and Methods. Data are reported as a mean ± SD of four separate experiments performed in triplicate.
Figure 7
Figure 7
Cycloheximide inhibits the A23187- and thapsigargin-dependent increase of calreticulin mRNA levels. Total RNA was isolated from nontransfected NIH/3T3 cells that had been incubated for 16–18 h with 7 μM A23187 or 100 nM thapsigargin, and either with or without cycloheximide. The RNA was separated electrophoretically on a formaldehyde-agarose gel, blotted onto Hybond N nylon filters, and hybridized with cDNA probes encoding mouse calreticulin and G3PDH as described in Materials and Methods. (Top) Autoradiogram of a Northern blot probed with calreticulin and the G3PDH cDNAs. (Lane 1) Control cells; (lane 2) cells incazxubated with 100 μM cycloheximide; (lane 3) A23187-treated cells; (lane 4) A23187- and cycloheximide-treated cells; (lane 5) thapsigargin-treated cells; (lane 6) thapsigargin- and cycloheximide-treated cells. (Bottom) The abundance of calreticulin mRNA (calreticulin mRNA/G3PDH mRNA ratio) was determined using Phosphorimager analysis of the Northern blots. (Filled bars) Cells treated with A23187 or thapsigargin in the absence of cycloheximide; (open bars) cells pretreated with 100 μM cycloheximide for 2 h followed by incubation with either A23817 or thapsigargin. TG, thapsigargin.
Figure 8
Figure 8
Effects of BAPTA on A23187- and thapsigargin-dependent activation of calreticulin promoter. NCB1 cells were loaded with 10 μM BAPTA/AM for 30 min in a media containing different drugs for 16 h and lysed, and reporter gene analysis was carried out as described in Materials and Methods. (Open bars) Cells grown and incubated with 7 μM A23187 or 100 nM thapsigargin in DME supplemented with 100 μM EGTA; (dotted bars) cells loaded with BAPTA/AM followed by incubation with either A23187 or thapsigargin (control cells were not treated with BAPTA/AM); (filled bars) cells loaded with BAPTA/AM and incubated with either A23187 or thapsigargin in Ca2+-depleted DME. (Cross-hatched bars) Cells loaded with 10 μM EGTA/AM for 30 min followed by 16-h incubation with either A23187 or thapsigargin in DME (control cells were not treated with EGTA/ AM); data are shown as a mean ± SD.
Figure 9
Figure 9
Effects of bradykinin on activation of calreticulin promoter. NCB1 cells were incubated with either 100 nM thapsigargin (TG) or 200 nM bradykinin (BK) in Ca2+-depleted DME supplemented with EGTA. After 16 h the cells were lysed, and then reporter gene analysis was carried out as described in Materials and Methods. Data are shown as a mean ± SD.

Similar articles

Cited by

References

    1. Ausubel, F.M., R.E. Kingston, D.D. Moore, J.G. Seidman, J.A. Smith, and K. Struhl. 1989. Current Protocols in Molecular Biology. Vols. 1 and 2.
    1. Bachs O, Agell N, Carafoli E. Calcium and calmodulin function in the cell nucleus. Biochim Biophys Acta. 1992;1113:259–270. - PubMed
    1. Baksh S, Burns K, Andrin C, Michalak M. Interaction of calreticulin with protein disulfide isomerase. J Biol Chem. 1995;270:31338–31344. - PubMed
    1. Bastianutto C, Clementi E, Codazzi F, Podini P, De Giorgi F, Rizzuto R, Meldolesi J, Pozzan T. Overexpression of calreticulin increases the Ca2+ capacity of rapidly exchanging Ca2+stores and reveals aspects of their lumenal microenvironment and function. J Cell Biol. 1995;130:847–855. - PMC - PubMed
    1. Bergeron JGM, Brenner MB, Thomas DY, Williams D. Calnexin: a membrane-bound chaperone of the endoplasmic reticulum. TIBS. 1994;19:124–128. - PubMed

Publication types

MeSH terms

Associated data