. 1997 Jun;109(6):731-40.
doi: 10.1085/jgp.109.6.731.

A highly temperature-sensitive proton current in mouse bone marrow-derived mast cells

Affiliations

A highly temperature-sensitive proton current in mouse bone marrow-derived mast cells

M Kuno et al. J Gen Physiol. 1997 Jun.

Abstract

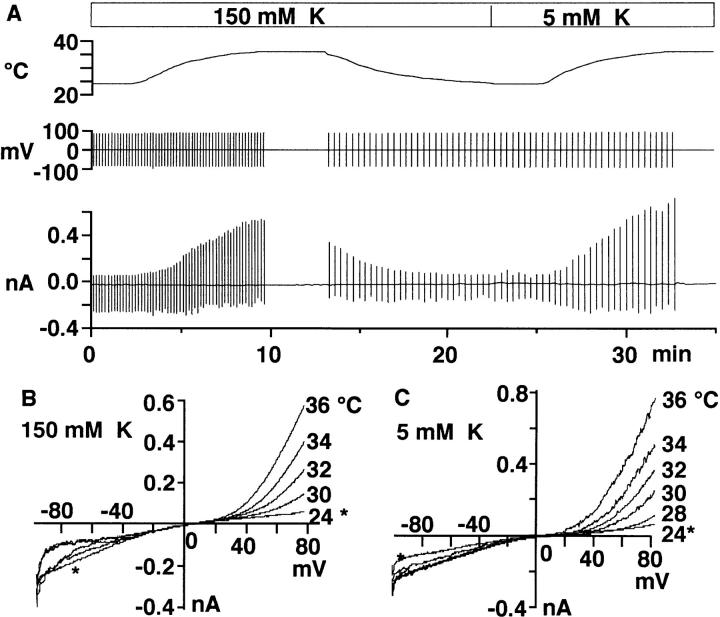
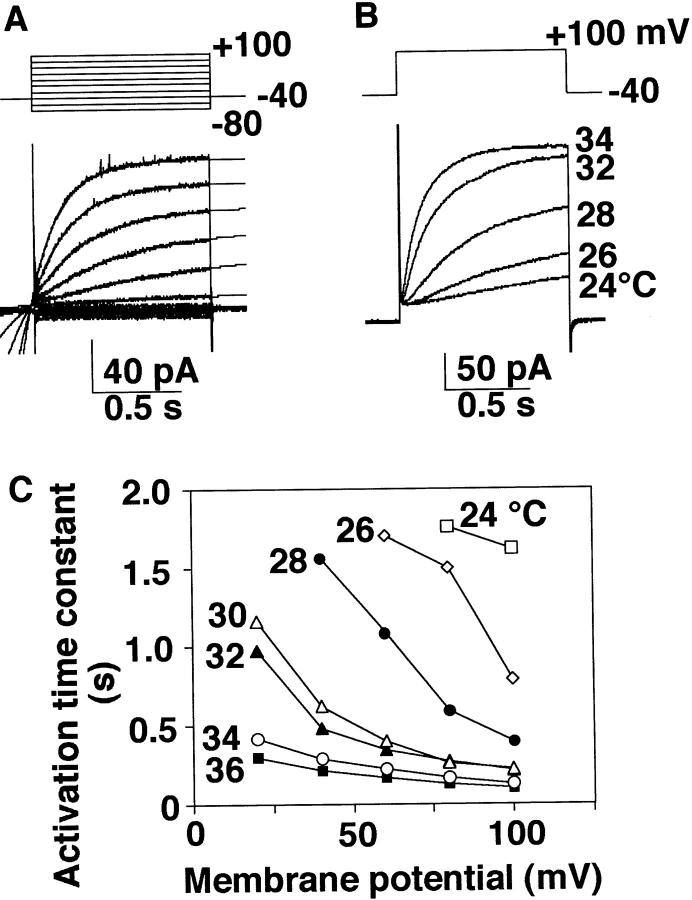
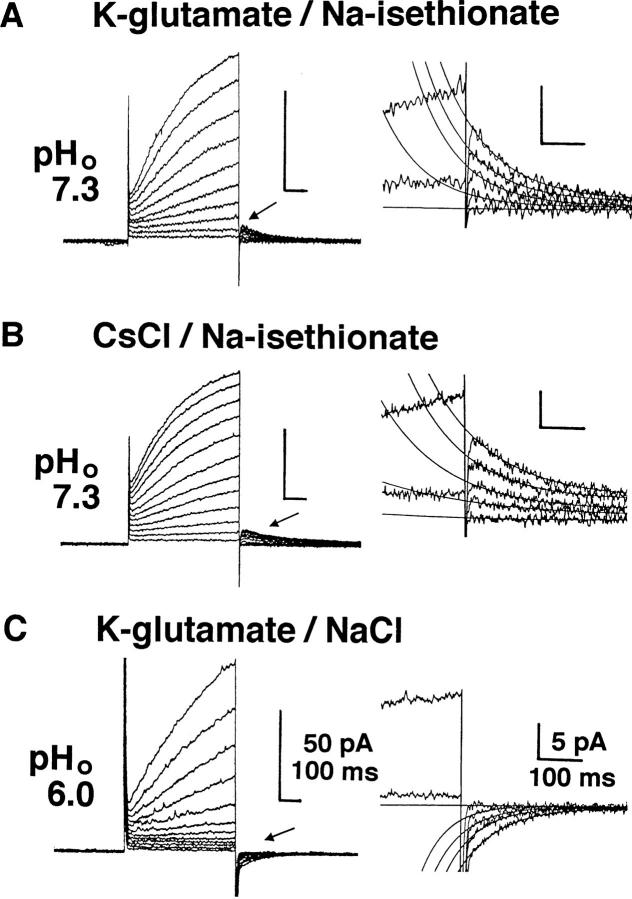
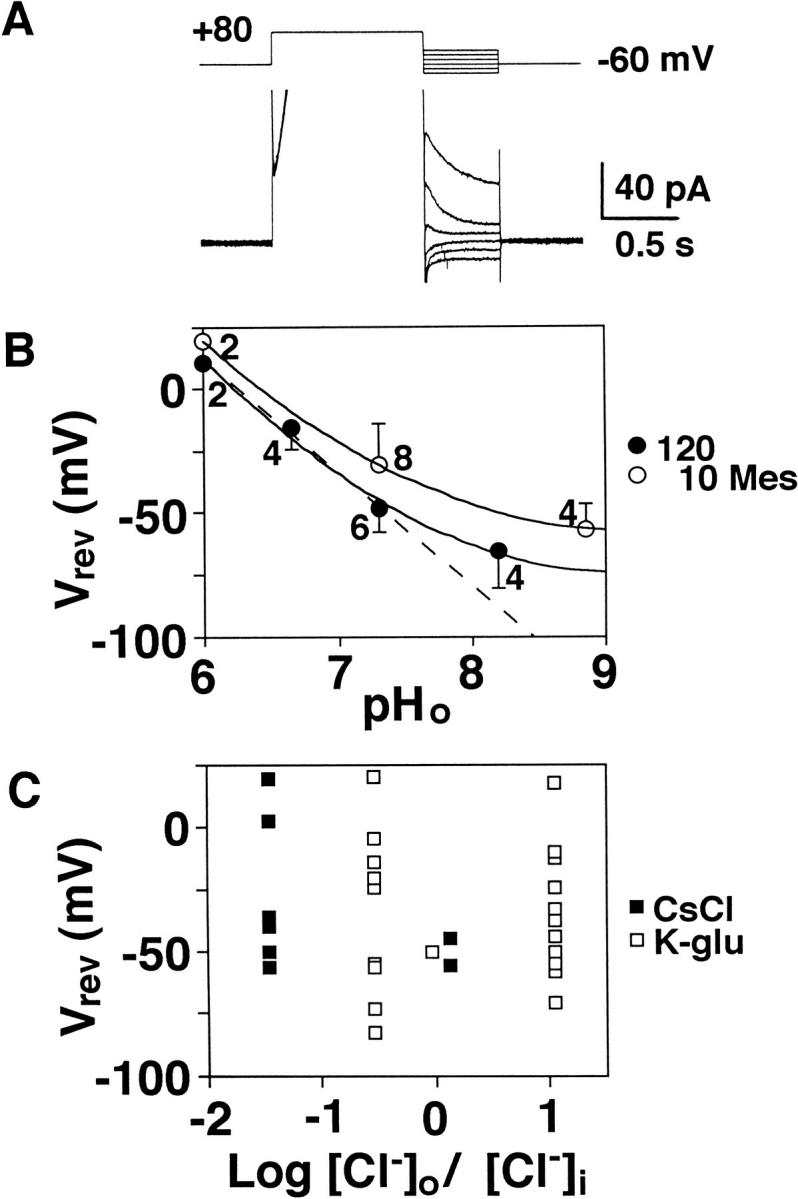
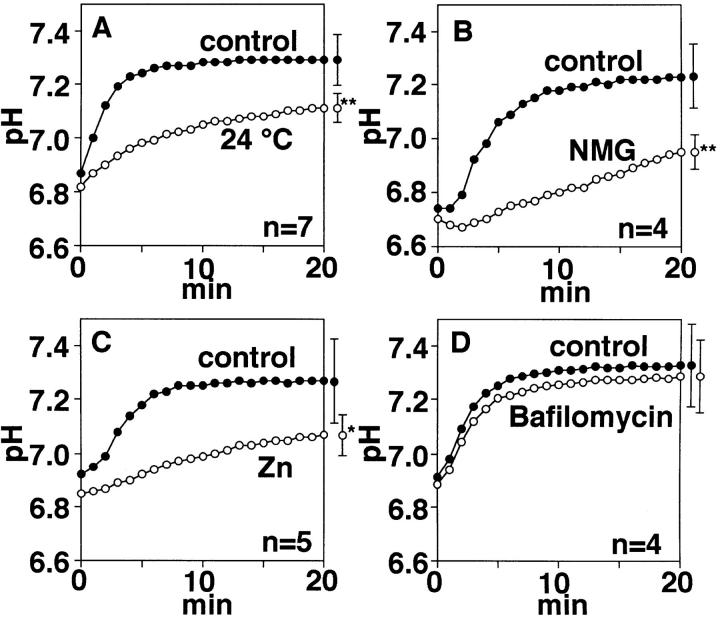
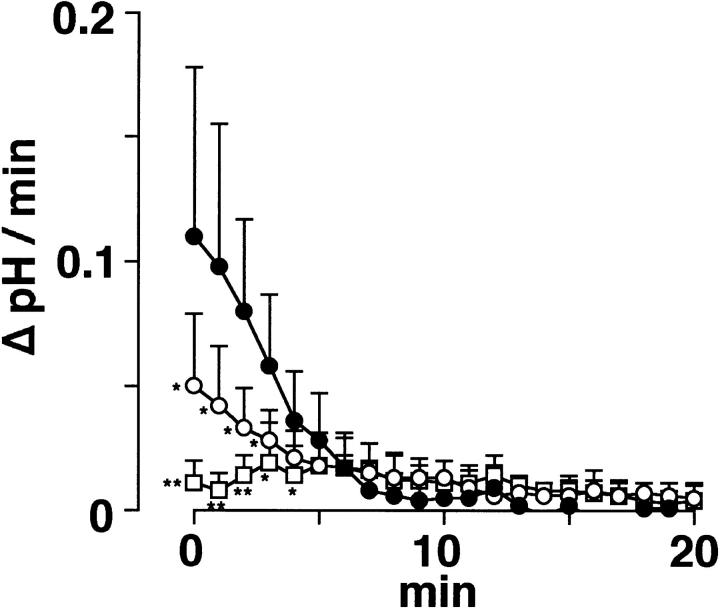
Proton (H+) conductive pathways are suggested to play roles in the regulation of intracellular pH. We characterized temperature-sensitive whole cell currents in mouse bone marrow-derived mast cells (BMMC), immature proliferating mast cells generated by in vitro culture. Heating from 24 to 36 degrees C reversibly and repeatedly activated a voltage-dependent outward conductance with Q10 of 9.9 +/- 3.1 (mean +/- SD) (n = 6). Either a decrease in intracellular pH or an increase in extracellular pH enhanced the amplitude and shifted the activation voltage to more negative potentials. With acidic intracellular solutions (pH 5.5), the outward current was detected in some cells at 24 degrees C and Q10 was 6.0 +/- 2.6 (n = 9). The reversal potential was unaffected by changes in concentrations of major ionic constituents (K+, Cl-, and Na+), but depended on the pH gradient, suggesting that H+ (equivalents) is a major ion species carrying the current. The H+ current was featured by slow activation kinetics upon membrane depolarization, and the activation time course was accelerated by increases in depolarization, elevating temperature and extracellular alkalization. The current was recorded even when ATP was removed from the intracellular solution, but the mean amplitude was smaller than that in the presence of ATP. The H+ current was reversibly inhibited by Zn2+ but not by bafilomycin A1, an inhibitor for a vacuolar type H(+)-ATPase. Macroscopic measurements of pH using a fluorescent dye (BCECF) revealed that a rapid recovery of intracellular pH from acid-load was attenuated by lowering temperature, addition of Zn2+, and depletion of extracellular K+, but not by bafilomycin A1. These results suggest that the H+ conductive pathway contributes to intracellular pH homeostasis of BMMC and that the high activation energy may be involved in enhancement of the H+ conductance.


Figures

Figure 1
Figure 1
Effects of changes in temperature on whole cell current. (A) Temperature (top), voltage (middle), and current (bottom) recordings during changes in bath temperature between 24 and 36°C. Vertical lines in the bottom indicate currents associated with voltage ramps applied at 0 mV. The cell was suspended first in the K+-rich (150 mM) solution and then in the standard (5 mM K) solution (pHo = 7.3). (B and C) Current-voltage relations obtained by voltage ramps during heating in 150 and 5 mM K+ solutions. *Denotes data at 24°C. A–C were obtained from the same cell. The pipette contained K-glutamate (pHp = 7.3).
Figure 2
Figure 2
Temperature-conductance relationships. (A and B) Outward (A) and inward (B) conductances of three cells plotted against temperature. Conductances were estimated from I-V curves obtained by voltage ramps applied at 0 mV, between +50 and +100 mV for outward currents and between −110 and −80 mV for the inward currents. Curves are the second order polynomial fit for data. (C) Semilogarithmic plots of the outward conductance against temperature. Data were normalized as the partition of the amplitude at 36°C. Different symbols indicate data from different cells (n = 6). The external solution contained the standard Ringer and the internal solution contained K-glutamate (pHp/ pHo = 7.3/7.3). The line is a least square's fit for all data.
Figure 3
Figure 3
Characteristics of heating-activated outward current. (A) A family of currents obtained by voltage steps in 20-mV increments applied at −40 mV and superimposed single exponential fits. The currents were recorded at 32°C. (B) Outward currents evoked by a depolarization pulse of +100 mV applied at −40 mV when temperature was elevated from 24 to 34°C. (C) Activation time constant at different potentials. B and C are obtained from the same cell. The pHp/pHo was 5.5/7.3. The internal buffer was 120 mM Mes.
Figure 4
Figure 4
Effects of pHp and pHo on heating-activated outward current. (A) Averaged I-V plots with pHo 7.3 at pHp 5.5 (squares, n = 9), 6.6 (triangles, n = 3), and 7.3 (circles, n = 7). The current was measured at the end of 500-ms voltage pulses. The internal buffer (Mes) was 10 mM in seven of nine cells at pHp 5.5 and 120 mM in two cells at pHp 5.5 and in three cells at pHp 6.6. B, I-V relations obtained from voltage ramp applied at 0 mV when the pHo was changed from 7.3 (1) to 8.7 (2) and then returned to 7.3 (3). The internal medium contained K-glutamate. (C) I-V relations recorded with the pipette solution containing CsCl when the pHo was increased from 7.3 to 9.0. B and C were obtained from different cells at pHp 5.5 with 10 mM Mes. Leak current was subtracted. A–C were obtained at 32°C.
Figure 5
Figure 5
Heating-activated outward current recorded in various internal and external solutions. Whole cell currents evoked by voltage pulses up to +100 (A) or +120 mV (B and C) in +10-mV increments at pHp 5.5 (32°C). The holding potential was 0 mV. The internal solution was buffered with 120 mM Mes. Selected traces of tail currents (arrows) were magnified with superimposed single exponential fits (right). (A) The internal and external media contained K-glutamate and Na-isethionate, respectively. Tail currents induced by prepulse of +10, +30, +50, +70, and +100 mV are superimposed. (B) The internal and external media contained CsCl and Na-isethionate. Tail currents with prepulse of +10, +30, +40, +60, and +100 mV are superimposed. (C) The internal and external media contained K-glutamate and NaCl. Tail currents at +10, +70, +90, +100, and +120 mV are superimposed. 50 μM of DIDS was added into all external media. pHo: 7.3 (A and B) and 6.0 (C).
Figure 6
Figure 6
Reversal potential of heating-activated outward current. (A) Tail currents after a depolarization prepulse (+80 mV) at pHp 5.5. The outward current evoked by the prepulse is truncated. (B) Relationships between pHo and the reversal potential (Vrev) estimated from tail currents following a prepulse of either +80 or +100 mV (1 s). Open and closed circles represent mean and SD of data recorded with 10 and 120 mM Mes. The solid curves are fitted by eye and the dotted line, a linear regression for data at pHo 6.0, 6.7, and 7.3 with 120 mM Mes. Figures attached with data indicate the number of cells. (C) Vrev plotted against the ratio between extracellular and intracellular Cl concentrations ([Cl]o/[Cl]i) on a semilogarithmic scale. Open and closed squares represent data recorded with K-glutamate and CsCl in the internal solution, respectively. B and C were obtained from the same data. The external medium was same (standard Ringer) except for pHo.
Figure 7
Figure 7
Blockade of H+ current by Zn2+. Whole cell currents evoked by voltage pulses from −80 to +100 mV in 20-mV steps applied at −40 mV at 32°C (pHp/pHo = 5.5/7.3). The outward current was reversibly inhibited by 0.25 mM ZnCl2. The internal solution contained K-glutamate and 120 mM Mes and the external solution, Na-isethionate.
Figure 8
Figure 8
Effects of intracellular ATP on H+ current. I-V plots normalized by the cell capacitance for each 10 cells recorded with ATP (1 mM)-containing (A) and ATP-omitting (B) intracellular solutions. The current amplitude was measured at the end of 500-ms voltage pulses applied at −40 mV at 32°C (pHp/pHo = 5.5/ 7.3). The pipette solution was buffered with 120 mM Mes.
Figure 9
Figure 9
Macroscopic measurements of pHi recovery in acid-loaded cells. Populations of cells were loaded with BCECF-AM and incubated in the presence of 40 mM NH4Cl for 15 min. The ordinate indicates averaged pHi in these cells after washings with ammonium-free solutions. Closed circles in A–D represent data recorded at 36°C in the Na+-free, K+-rich solution (control). Open circles represent averaged pHi at 24°C in the K+-rich medium (A, n = 7), in the Na+-free NMG+-rich solution (B, n = 4), in the presence of 0.5 mM ZnCl2 (C, n = 5), and 100 nM bafilomycin A1 (D, n = 4) in the K+-rich solution. Symbols with bars at right are mean ± SD for data at 20 min; * and ** indicate P < 0.05 and P < 0.01, respectively. Changes in pHi in B–C were measured at 36°C.
Figure 10
Figure 10
The rate of pHi recovery from acidification. The rate of pHi change per time (ΔpH/min) during the recovery from acidification was obtained by differentiating individual pHi recordings averaged in Fig. 9, A and C. Open circles, squares, and closed circles represent mean and SD of the ΔpH/min at 24°C (n = 7) in the presence of 0.5 mM Zn2+ (n = 5) and their controls (n = 12). The acid-loaded cells were suspended in the K+-rich medium. The pHi in the Zn2+-containing or control solutions was measured at 36°C.

Similar articles

Cited by

References

    1. Alfonso A, Botana MA, Vieytes MR, Louzao MC, Botana LM. Effect of signal transduction pathways on the action of thapsigargin on rat mast cells: crosstalks between cellular signaling and cytosolic pH. Biochem Pharmacol. 1994;47:1813–1820. - PubMed
    1. Barish ME, Baud C. A voltage-gated hydrogen ion current in the oocyte membrane of the axolotl Ambystoma. . J Physiol (Lond) 1984;352:243–263. - PMC - PubMed
    1. Bernheim L, Krause RM, Baroffio A, Hamann M, Kaelin A, Bader C-R. A voltage-dependent proton current in cultured human skeletal muscle myotubes. J Physiol (Lond) 1993;470:313–333. - PMC - PubMed
    1. Bowman EJ, Siebers A, Altendorf K. Bafilomycins: a class of inhibitors of membrane ATPases from microorganisms, animal cells, and plant cells. Proc Natl Acad Sci USA. 1988;85:7972–7976. - PMC - PubMed
    1. Byerly L, Meech R, Moody W., Jr Rapidly activating hydrogen ion currents in perfused neurones of the snail, Lymnaea Stagnalis. . J Physiol (Lond) 1984;351:199–216. - PMC - PubMed

Publication types