Quantitative ultrastructural analysis of hippocampal excitatory synapses
- PMID: 9221783
- PMCID: PMC6573206
- DOI: 10.1523/JNEUROSCI.17-15-05858.1997
Quantitative ultrastructural analysis of hippocampal excitatory synapses
Abstract
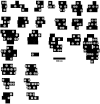
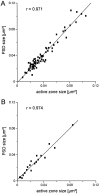
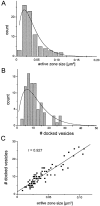
From three-dimensional reconstructions of CA1 excitatory synapses in the rodent hippocampus and in culture, we have estimated statistical distributions of active zone and postsynaptic density (PSD) sizes (average area approximately 0.04 micron2), the number of active zones per bouton (usually one), the number of docked vesicles per active zone (approximately 10), and the total number of vesicles per bouton (approximately 200), and we have determined relationships between these quantities, all of which vary from synapse to synapse but are highly correlated. These measurements have been related to synaptic physiology. In particular, we propose that the distribution of active zone areas can account for the distribution of synaptic release probabilities and that each active zone constitutes a release site as identified in the standard quantal theory attributable to Katz (1969).
Figures


Similar articles
-
Variation in the number, location and size of synaptic vesicles provides an anatomical basis for the nonuniform probability of release at hippocampal CA1 synapses.Neuropharmacology. 1995 Nov;34(11):1387-95. doi: 10.1016/0028-3908(95)00142-s. Neuropharmacology. 1995. PMID: 8606788
-
BDNF enhances quantal neurotransmitter release and increases the number of docked vesicles at the active zones of hippocampal excitatory synapses.J Neurosci. 2001 Jun 15;21(12):4249-58. doi: 10.1523/JNEUROSCI.21-12-04249.2001. J Neurosci. 2001. PMID: 11404410 Free PMC article.
-
Inactivity produces increases in neurotransmitter release and synapse size.Neuron. 2001 Nov 20;32(4):673-82. doi: 10.1016/s0896-6273(01)00500-1. Neuron. 2001. PMID: 11719207
-
Small vesicle bouton synapses on the distal half of the lateral dendrite of the goldfish Mauthner cell: freeze-fracture and thin section study.J Comp Neurol. 1987 Nov 8;265(2):254-74. doi: 10.1002/cne.902650209. J Comp Neurol. 1987. PMID: 3320111 Review.
-
Quantal analysis and synaptic anatomy--integrating two views of hippocampal plasticity.Trends Neurosci. 1993 Apr;16(4):141-7. doi: 10.1016/0166-2236(93)90122-3. Trends Neurosci. 1993. PMID: 7682347 Review.
Cited by
-
Actomyosin-mediated inhibition of synaptic vesicle release under CB1R activation.Transl Psychiatry. 2024 Aug 21;14(1):335. doi: 10.1038/s41398-024-03017-4. Transl Psychiatry. 2024. PMID: 39168993 Free PMC article.
-
Regulation of synaptic activity by snapin-mediated endolysosomal transport and sorting.EMBO J. 2015 Aug 4;34(15):2059-77. doi: 10.15252/embj.201591125. Epub 2015 Jun 24. EMBO J. 2015. PMID: 26108535 Free PMC article.
-
A preferentially segregated recycling vesicle pool of limited size supports neurotransmission in native central synapses.Neuron. 2012 Nov 8;76(3):579-89. doi: 10.1016/j.neuron.2012.08.042. Neuron. 2012. PMID: 23141069 Free PMC article.
-
GABA release by hippocampal astrocytes.Front Comput Neurosci. 2012 Aug 17;6:59. doi: 10.3389/fncom.2012.00059. eCollection 2012. Front Comput Neurosci. 2012. PMID: 22912614 Free PMC article.
-
Two modes of exocytosis at hippocampal synapses revealed by rate of FM1-43 efflux from individual vesicles.J Cell Biol. 2005 Mar 14;168(6):929-39. doi: 10.1083/jcb.200407148. J Cell Biol. 2005. PMID: 15767463 Free PMC article.
References
-
- Almers W, Tse FW. Transmitter release from synapses: does a preassembled fusion pore initiate exocytosis. Neuron. 1990;4:813–818. - PubMed
-
- Bekkers JM, Stevens CF. NMDA and non-NMDA receptors are co-localized at individual excitatory synapses in cultured rat hippocampus. Nature. 1989;341:230–233. - PubMed
-
- Betz WJ, Bewick GS. Optical analysis of synaptic vesicle recycling at the frog neuromuscular junction. Science. 1992;255:200–203. - PubMed
Publication types
MeSH terms
Grants and funding
LinkOut - more resources
Full Text Sources
Miscellaneous
