. 1997 Jul 8;94(14):7245-50.
doi: 10.1073/pnas.94.14.7245.

Distinct roles for E2F proteins in cell growth control and apoptosis

Affiliations

Distinct roles for E2F proteins in cell growth control and apoptosis

J DeGregori et al. Proc Natl Acad Sci U S A. .

Abstract

E2F transcription activity is composed of a family of heterodimers encoded by distinct genes. Through the overproduction of each of the five known E2F proteins in mammalian cells, we demonstrate that a large number of genes encoding proteins important for cell cycle regulation and DNA replication can be activated by the E2F proteins and that there are distinct specificities in the activation of these genes by individual E2F family members. Coexpression of each E2F protein with the DP1 heterodimeric partner does not significantly alter this specificity. We also find that only E2F1 overexpression induces cells to undergo apoptosis, despite the fact that at least two other E2F family members, E2F2 and E2F3, are equally capable of inducing S phase. The ability of E2F1 to induce apoptosis appears to result from the specific induction of an apoptosis-promoting activity rather than the lack of induction of a survival activity, because co-expression of E2F2 and E2F3 does not rescue cells from E2F1-mediated apoptosis. We conclude that E2F family members play distinct roles in cell cycle control and that E2F1 may function as a specific signal for the initiation of an apoptosis pathway that must normally be blocked for a productive proliferation event.


Figures

Figure 1
Figure 1
Induction of S phase by E2F family members. (A) Overexpression of each of the E2F family members in REF52 cells. REF52 cells were deprived of serum for 48 hr (0.25% serum) and then infected with either the control recombinant adenovirus (Ad-Con) or with a recombinant expressing the indicated E2F family member (E2F1, E2F2, E2F3, E2F4, or E2F5) at an moi of 75 ffu/ml for each virus. A virus expressing the DP1 protein, Ad-DP1, was coinfected (moi of 75 ffu/ml) with each E2F expressing virus. Following infection, the cells were returned to 0.25% serum media. The cells were harvested 15 hr postinfection for Western blot analysis using the corresponding antibody specific for the indicated E2F family member. (B) Production of E2F activity following infection with recombinant adenoviruses. Starved REF52 cells were infected with either the control recombinant adenovirus (Con) or with a recombinant expressing the indicated E2F family member at the following mois: Ad-Con, Ad-E2F1, Ad-E2F2, Ad-E2F4, and Ad-E2F5 at 400 ffu/ml, or Ad-E2F3 at 800 ffu/ml. Even at the elevated moi used for Ad-E2F3, less activity was produced than for the other E2Fs. Five hours postinfection, the cells were stimulated with 10% serum and then harvested 15 hr later for an electrophoretic mobility shift assay using a DHFR E2F binding site as a probe. Complexes specific for each overexpressed E2F are indicated with an asterisk. Where indicated, a polyclonal antibody against the DP1 protein (+) or control rabbit immunoglobulin (−) was added to the binding reaction after 20 min, and the reaction continued for an additional 20 min. Lanes 2 and 3 depict competition with either wildtype (wt) or mutant (mt) binding sites. (C) E2F family members induce S phase in quiescent cells. Serum starved REF52 cells were infected as described in Fig. 1B. Following infection, the cells were returned to either 10% serum media (Con+, left bar) or 0.25% serum media (other bars). Cells were labeled with BrdUrd from 12 to 30 hr, and BrdUrd incorporation was determined by indirect immunofluorescence. At least 200 nuclei were scored for BrdUrd incorporation.
Figure 2
Figure 2
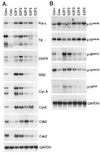
Specificity in the activation of target genes by E2F family members. (A) Activation of DNA synthesis and cell cycle regulatory genes by E2F proteins. REF52 cells were deprived of serum for 48 hr and then infected with the indicated recombinant viruses as described in Fig. 1B. Con+ was stimulated by the addition of 10% serum, and the others remained in 0.25% serum. The cells were harvested at either 18 hr (Con+) or 21 hr (others) postinfection, and poly(A)+ RNA was isolated. Poly(A)+ RNA (derived from 330 μg of total RNA per lane) was then separated by agarose gel electrophoresis, transferred to nylon membrane, and probed with the indicated cDNAs. Equivalent loading of RNA was confirmed by probing with the GAPDH cDNA. The hybridizing species in the thymidine kinase blot unique to the E2F4 sample represents cross-hybridization with a viral specific RNA. (B) Induction of CKI genes. REF52 cells were infected and harvested as described in A. Poly(A)+ RNA (derived from 400 μg of total RNA per lane) was then separated by agarose gel electrophoresis, transferred to nylon membrane, and probed with the indicated cDNAs. Exon I-specific fragments were used as probes for p15INK4B, p16INK4A, and p19ARF.
Figure 3
Figure 3
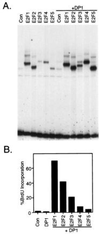
Coexpression of DP1 does not alter E2F function. (A) Coexpression of DP1 enhances the production of E2F DNA binding activity. Serum starved REF52 cells were infected as described in Fig. 1B, except where indicated. Ad-DP1 was coinfected at an moi of 400 ffu/cell together with the indicated E2F expressing virus or control (Con) virus. At 5 hr postinfection, the cells were stimulated with 10% serum and then harvested 15 hr later for an electrophoretic mobility shift assay using a DHFR E2F binding site as a probe. (B) Induction of S phase by E2F family members when coexpressed with DP1. Starved REF52 cells were infected with the indicated recombinant viruses at the following mois: Ad-E2F1, Ad-E2F2, Ad-E2F3, Ad-E2F4, Ad-E2F5 at 100 ffu/cell, Ad-DP1 at 50 ffu/cell, and Ad-Con at 150 ffu/cell. Following infection, the cells were returned to 0.25% serum. Cells were labeled with BrdUrd from 12 to 30 hr, and BrdUrd incorporation was determined as described in Fig. 1B.
Figure 4
Figure 4
The unique capacity of E2F1 to induce apoptosis (A) E2F1, but not the other E2F family members, induces apoptosis. REF52 cells were deprived of serum for 48 hr, and then infected with the indicated recombinant viruses at an moi of 200 ffu/cell. Following infection, the cells were returned to 0.25% serum media and harvested at either 4 or 5 days postinfection for analysis by flow cytometry. The horizontal axis reflects relative DNA content, and the vertical axis represents cell number. The position of cells with less than a G1 DNA content, indicative of apoptosis, is shown by an arrow. (B) A comparison of the relative abilities of E2F1 and E2F2 to induce apoptosis. REF52 cells were deprived of serum for 48 hr and then infected with Ad-E2F1 or Ad-E2F2 at either a low (50 ffu/cell), medium (100 ffu/cell), or high (200 ffu/cell) moi. Alternatively, cells were infected with Ad-Con at 100 ffu/cell. Following infection, the cells were returned to 0.25% serum media and harvested at either 4, 5, or 6 days postinfection for analysis by flow cytometry. (C) E2F1, but not E2F2, expressing cells exhibit morphological characteristics of apoptosis. Cells from Fig. 4B were photographed at 5 days postinfection, and representative photographs are shown. (D) Both E2F1 and E2F2 induce S phase. Cells from Fig. 4B were also labeled with BrdUrd from 10 to 40 hr postinfection, and BrdUrd incorporation was determined as described in Fig. 1B.
Figure 5
Figure 5
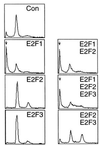
E2F1 induces apoptosis in the presence of each of the E2F activities. REF52 cells were deprived of serum for 48 hr and then were infected with the indicated E2F expressing recombinant viruses at an moi of 100 ffu/cell for each virus. Alternatively, cells were infected with Ad-Con at 100 ffu/cell. Following infection, the cells were returned to 0.25% serum media and harvested at 5 days postinfection for analysis by flow cytometry. The horizontal axis reflects relative DNA content, and the vertical axis represents cell number. The position of cells with less than a G1 DNA content, indicative of apoptosis, is shown by an arrow.
Figure 6
Figure 6
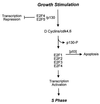
Distinct roles for E2F proteins in cell growth and apoptosis.

Similar articles

Cited by

References

    1. Sherr C J. Cell. 1993;73:1059–1065. - PubMed
    1. Hunter T. Cell. 1993;75:839–841. - PubMed
    1. Nevins J R. Science. 1992;258:424–429. - PubMed
    1. Helin K, Harlow E. Trends Cell Biol. 1993;3:43–46. - PubMed
    1. La Thangue N B. Trends Biochem Sci. 1994;19:108–114. - PubMed

Publication types

LinkOut - more resources