Folding funnels and energy landscapes of larger proteins within the capillarity approximation
- PMID: 9177189
- PMCID: PMC21021
- DOI: 10.1073/pnas.94.12.6170
Folding funnels and energy landscapes of larger proteins within the capillarity approximation
Abstract
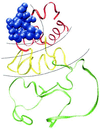
The characterization of protein-folding kinetics with increasing chain length under various thermodynamic conditions is addressed using the capillarity picture in which distinct spatial regions of the protein are imagined to be folded or trapped and separated by interfaces. The quantitative capillarity theory is based on the nucleation theory of first-order transitions and the droplet analysis of glasses and random magnets. The concepts of folding funnels and rugged energy landscapes are shown to be applicable in the large size limit just as for smaller proteins. An ideal asymptotic free-energy profile as a function of a reaction coordinate measuring progress down the funnel is shown to be quite broad. This renders traditional transition state theory generally inapplicable but allows a diffusive picture with a transition-state region to be used. The analysis unifies several scaling arguments proposed earlier. The importance of fluctuational fine structure both to the free-energy profile and to the glassy dynamics is highlighted. The fluctuation effects lead to a very broad trapping-time distribution. Considerations necessary for understanding the crossover between the mean field and capillarity pictures of the energy landscapes are discussed. A variety of mechanisms that may roughen the interfaces and may lead to a complex structure of the transition-state ensemble are proposed.
Figures


Similar articles
-
Protein folding kinetics: timescales, pathways and energy landscapes in terms of sequence-dependent properties.Fold Des. 1997;2(1):1-22. doi: 10.1016/S1359-0278(97)00002-3. Fold Des. 1997. PMID: 9080195
-
Exploring structures in protein folding funnels with free energy functionals: the transition state ensemble.J Mol Biol. 1999 Apr 2;287(3):675-94. doi: 10.1006/jmbi.1999.2613. J Mol Biol. 1999. PMID: 10092467
-
Capillarity-like growth of protein folding nuclei.Proc Natl Acad Sci U S A. 2008 Aug 12;105(32):11164-9. doi: 10.1073/pnas.0711527105. Epub 2008 Aug 4. Proc Natl Acad Sci U S A. 2008. PMID: 18678894 Free PMC article.
-
Folding funnels, binding funnels, and protein function.Protein Sci. 1999 Jun;8(6):1181-90. doi: 10.1110/ps.8.6.1181. Protein Sci. 1999. PMID: 10386868 Free PMC article. Review.
-
Cooperativity and protein folding rates.Curr Opin Struct Biol. 2010 Feb;20(1):11-5. doi: 10.1016/j.sbi.2009.12.013. Epub 2010 Jan 21. Curr Opin Struct Biol. 2010. PMID: 20093004 Review.
Cited by
-
Genomic Energy Landscapes.Biophys J. 2017 Feb 7;112(3):427-433. doi: 10.1016/j.bpj.2016.08.046. Epub 2016 Sep 30. Biophys J. 2017. PMID: 27692923 Free PMC article. Review.
-
Dynamics, energetics, and structure in protein folding.Biochemistry. 2006 Jul 18;45(28):8466-75. doi: 10.1021/bi060643c. Biochemistry. 2006. PMID: 16834320 Free PMC article. Review.
-
Folding simulations of a de novo designed protein with a betaalphabeta fold.Biophys J. 2010 Jan 20;98(2):321-9. doi: 10.1016/j.bpj.2009.10.018. Biophys J. 2010. PMID: 20338854 Free PMC article.
-
Modulation of folding kinetics of repeat proteins: interplay between intra- and interdomain interactions.Biophys J. 2012 Oct 3;103(7):1555-65. doi: 10.1016/j.bpj.2012.08.018. Epub 2012 Oct 2. Biophys J. 2012. PMID: 23062348 Free PMC article.
-
Trp-cage: folding free energy landscape in explicit water.Proc Natl Acad Sci U S A. 2003 Nov 11;100(23):13280-5. doi: 10.1073/pnas.2233312100. Epub 2003 Oct 27. Proc Natl Acad Sci U S A. 2003. PMID: 14581616 Free PMC article.
References
-
- Bryngelson J D, Wolynes P G. J Phys Chem. 1989;93:6902–6915.
-
- Bryngelson J D, Onuchic J N, Socci N D, Wolynes P G. Proteins. 1995;21:167–195. - PubMed
Publication types
MeSH terms
Substances
Grants and funding
LinkOut - more resources
Full Text Sources

