. 1997 Jun 2;137(5):1149-60.
doi: 10.1083/jcb.137.5.1149.

Regulated production of mineralization-competent matrix vesicles in hypertrophic chondrocytes

Affiliations

Regulated production of mineralization-competent matrix vesicles in hypertrophic chondrocytes

T Kirsch et al. J Cell Biol. .

Abstract

Matrix vesicles have a critical role in the initiation of mineral deposition in skeletal tissues, but the ways in which they exert this key function remain poorly understood. This issue is made even more intriguing by the fact that matrix vesicles are also present in nonmineralizing tissues. Thus, we tested the novel hypothesis that matrix vesicles produced and released by mineralizing cells are structurally and functionally different from those released by nonmineralizing cells. To test this hypothesis, we made use of cultures of chick embryonic hypertrophic chondrocytes in which mineralization was triggered by treatment with vitamin C and phosphate. Ultrastructural analysis revealed that both control nonmineralizing and vitamin C/phosphatetreated mineralizing chondrocytes produced and released matrix vesicles that exhibited similar round shape, smooth contour, and average size. However, unlike control vesicles, those produced by mineralizing chondrocytes had very strong alkaline phosphatase activity and contained annexin V, a membrane-associated protein known to mediate Ca2+ influx into matrix vesicles. Strikingly, these vesicles also formed numerous apatite-like crystals upon incubation with synthetic cartilage lymph, while control vesicles failed to do so. Northern blot and immunohistochemical analyses showed that the production and release of annexin V-rich matrix vesicles by mineralizing chondrocytes were accompanied by a marked increase in annexin V expression and, interestingly, were followed by increased expression of type I collagen. Studies on embryonic cartilages demonstrated a similar sequence of phenotypic changes during the mineralization process in vivo. Thus, chondrocytes located in the hypertrophic zone of chick embryo tibial growth plate were characterized by strong annexin V expression, and those located at the chondro-osseous mineralizing border exhibited expression of both annexin V and type I collagen. These findings reveal that hypertrophic chondrocytes can qualitatively modulate their production of matrix vesicles and only when induced to initiate mineralization, will release mineralization-competent matrix vesicles rich in annexin V and alkaline phosphatase. The occurrence of type I collagen in concert with cartilage matrix calcification suggests that the protein may facilitate crystal growth after rupture of the matrix vesicle membrane; it may also offer a smooth transition from mineralized type II/type X collagen-rich cartilage matrix to type I collagen-rich bone matrix.


Figures

Figure 1
Figure 1
Phase contrast micrographs of cultures of hypertrophic chondrocytes treated with vitamin C and phosphate. Tibia chondrocytes were grown to confluency and then maintained in culture for a further 14 d in the absence (A) or presence of vitamin C (50 μg/ml) and 2.5 mM phosphate (B). Note the presence of abundant opaque mineral deposits in vitamin C/phosphate-treated cultures (B).
Figure 2
Figure 2
Histograms showing alkaline phosphatase activity and calcium and phosphate content of chondrocyte cultures supplemented with or without vitamin C and/or phosphate. Confluent cultures of day 19 chick embryonic growth plate chondrocytes were treated for 14 d with vitamin C (50 μg/ml) and 2.5 mM phosphate. Control cultures were maintained for 14 d in the absence of either of these supplements. Cultures were harvested and alkaline phosphatase, Ca2+, and Pi content determined. Data were obtained from three different cultures; values are mean ± SE.
Figure 3
Figure 3
SDS-PAGE and immunoblot analysis of matrix vesicles isolated from vitamin C/phosphate-treated and control chondrocyte cultures. Pellets of matrix vesicles which were isolated from the cell layer of vitamin C/ phosphate-treated (lanes a and c) or control chondrocyte cultures (lanes b and d) were boiled in SDS–sample buffer, analyzed by SDS-PAGE on 10% (wt/vol) polyacrylamide gels, and stained with Coomassie blue to visualize the protein bands (lanes a and b), or the proteins were transferred electrophoretically to nitrocellulose filters for immunoblot analysis of annexin V (lanes c and d). Note the difference in the protein profile of both matrix vesicle preparations. Also note the immunostaining for annexin V (AV) in vesicles isolated from vitamin C/phosphate-treated cultures (lane c), whereas there was no staining in vesicles prepared from control cultures (lane d).
Figure 4
Figure 4
Immunoblot analyses of matrix vesicles from vitamin C/phosphate-treated and control chondrocyte cultures using antibodies against types I, II, and X collagen. Pellets of matrix vesicles isolated from vitamin C/phosphate-treated (lanes a, c, and e) or control chondrocyte cultures (lanes b, d, and f) were analyzed by SDS-PAGE on 8% (wt/vol) polyacrylamide gels and transferred electrophoretically to nitrocellulose filters for immunoblot analysis of type II collagen (II, lanes a and b), type X collagen (X, lanes c and d) and type I collagen (I, lanes e and f). Note the immunostaining for type II collagen (lane a) and type X collagen (lane c) in vesicles isolated from vitamin C/phosphate-treated cultures, whereas there was no staining in vesicles prepared from control cultures (lanes b and d). No immunostaining for type I collagen was obtained in both vesicle preparations (lanes e and f). (Lane g [I Std.]) Purified type I collagen immunostained with antibodies against type I collagen.
Figure 5
Figure 5
Electron micrographs of matrix vesicles isolated from vitamin C/phosphate-treated chondrocyte (A–C) and control cultures (D) and incubated in synthetic cartilage lymph for 24 and 48 h. Matrix vesicles were isolated from control and vitamin C/phosphate-treated chondrocyte cultures as described in Materials and Methods and then incubated in synthetic cartilage lymph for 24 and 48 h at 37°C. (A) Freshly isolated matrix vesicles from vitamin C/phosphate-treated chondrocyte cultures without incubation in synthetic cartilage lymph. (B and C) Matrix vesicles isolated from vitamin C/ phosphate-treated cultures and incubated for 24 (B) and 48 h (C) in synthetic cartilage lymph. (D) Matrix vesicles isolated from control cultures and incubated for 48 h in synthetic cartilage lymph. Note numerous needle-like crystals associated with matrix vesicles isolated from vitamin C/phosphate-treated cultures, while vesicles from control cultures showed no evidence of calcification. Bar, 100 nm.
Figure 6
Figure 6
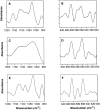
FT-IR spectra of matrix vesicles isolated from vitamin C/phosphate-treated or control chondrocyte cultures. (A, C, and E) Second derivative spectra of the ν1ν3 phosphate region of matrix vesicles isolated from vitamin C/phosphate-treated chondrocyte cultures and incubated in synthetic cartilage lymph for 24 h at 37°C (A), matrix vesicles isolated from control cultures and incubated in synthetic cartilage lymph for 24 h at 37°C (C), and hydroxyapatite (E). Note that in A, peaks can be seen at 960, 1,025, 1,065, 1,102 and 1,157 cm−1, while these bands are absent in matrix vesicles from control cultures (C). Also note the similarity of the spectra of mineralizing matrix vesicles (A) and hydroxyapatite (E). (B, D, and F) Second derivative structure in the ν4 domains (640–500 cm−1) of matrix vesicles isolated from vitamin C/ phosphate-treated cultures (B), matrix vesicles isolated from control cultures (D), and hydroxyapatite (F). Note that peaks at 626 and 539 cm−1, characteristic of HPO4 apatites, were clearly evident in mineralizing vesicle samples (B) but were markedly reduced in control samples (D). Both samples contained peaks at 561, 576, and 602 cm−1, which are representative of phosphate ions. Also note the similarity of the spectra of mineralizing matrix vesicles (B) and hydroxyapatite (F).
Figure 7
Figure 7
Proteoglycan content in control and mineralizing matrix vesicle preparations. Aliquots of matrix vesicle preparations isolated from control cultures (B, Control) or vitamin C/phosphate-treated chondrocyte cultures (B, Vit.C/Pi) were dotted onto nitrocellulose filters and immunostained with antibodies against aggrecan as described in Materials and Methods. (A) Different concentrations of purified aggrecan were dotted onto nitrocellulose filters and immunostained with antibodies against aggrecan. Densitometry was used to calculate the amount of aggrecan in the vesicle preparations using the staining intensities of the aggrecan dots as a standard curve. (C and D) EDS analysis of control matrix vesicles (C) and mineralizing matrix vesicles (D). Note that both vesicle preparations contain similar amounts of sulfur (peaks labeled with S; 77 counts in control matrix vesicles; 64 counts in mineralizing matrix vesicles). Also note that Ca2+ peaks are only present in mineralizing matrix vesicles (D, peaks labeled with Ca); in addition, mineralizing matrix vesicles contain more phosphate (peaks labeled with P) than control matrix vesicles.
Figure 7
Figure 7
Proteoglycan content in control and mineralizing matrix vesicle preparations. Aliquots of matrix vesicle preparations isolated from control cultures (B, Control) or vitamin C/phosphate-treated chondrocyte cultures (B, Vit.C/Pi) were dotted onto nitrocellulose filters and immunostained with antibodies against aggrecan as described in Materials and Methods. (A) Different concentrations of purified aggrecan were dotted onto nitrocellulose filters and immunostained with antibodies against aggrecan. Densitometry was used to calculate the amount of aggrecan in the vesicle preparations using the staining intensities of the aggrecan dots as a standard curve. (C and D) EDS analysis of control matrix vesicles (C) and mineralizing matrix vesicles (D). Note that both vesicle preparations contain similar amounts of sulfur (peaks labeled with S; 77 counts in control matrix vesicles; 64 counts in mineralizing matrix vesicles). Also note that Ca2+ peaks are only present in mineralizing matrix vesicles (D, peaks labeled with Ca); in addition, mineralizing matrix vesicles contain more phosphate (peaks labeled with P) than control matrix vesicles.
Figure 8
Figure 8
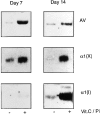
Expression of annexin V (AV), type X collagen (α1(X)), and type I collagen (α1(I)) genes in control and vitamin C/phosphatetreated chondrocyte cultures. Cultures of day 19 chick embryonic hypertrophic tibia chondrocytes were maintained in culture in DMEM containing 10% FCS. When the cells had reached confluency, half of the cultures received 50 μg/ml of freshly prepared vitamin C and 2.5 mM phosphate; the medium of both the treated ( + Vit.C/Pi) and control (− Vit.C/Pi) cultures was changed daily. After 7 or 14 d, total RNA was isolated from the control cultures or supplemented cultures and subjected to Northern blot analysis using annexin V, type X, and type I collagen 32P-labeled cDNA probes.
Figure 9
Figure 9
Immunofluorescence staining of chondrocyte cultures with antibodies against annexin V (Annexin V), type X (Type X), and type I collagen (Type I). Chondrocytes isolated from day 19 chick embryonic tibia cartilage were maintained in culture until confluent. They were then grown for additional 7 or 14 d in the absence (Control) or presence of vitamin C (50 μg/ml) and phosphate (2.5 mM; Vit.C/Pi) and then immunostained for annexin V, type X, and type I collagen. Note that after 14 d, control cultures were positive for annexin V (A) and type X collagen (B) but showed no staining for type I collagen (C). After 7 d of treatment with vitamin C and phosphate, chondrocytes were positive for annexin V (D) and type X collagen (E) and exhibited no staining for type I collagen (F). After 14 d of treatment, chondrocytes showed strong staining for annexin V (G), type X collagen (H), and type I collagen (I). Bar, 100 μm.
Figure 10
Figure 10
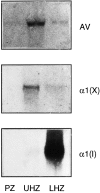
Northern blot analysis showing annexin V (AV), type X collagen (α1(X)), and type I collagen (α1(I)) in different zones of growth plate cartilage. RNA (10 μg/lane) isolated from the proliferative zone (PZ), upper hypertrophic zone (UHZ), and lower hypertrophic, calcifying zone (LHZ) of day 19 chick embryonic tibia were separated on agarose gels, blotted onto nylon membranes, and hybridized to 32P-labeled annexin V (AV), type X collagen (α1(X)), and type I collagen (α1(I)) cDNA probes. Note the presence of high amounts of annexin V and type X collagen message in the upper hypertrophic zone; in contrast, α1(I) is confined to the lower hypertrophic, calcifying zone.
Figure 11
Figure 11
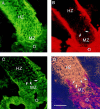
Localization of type X collagen, type I collagen, annexin V, and calcium deposits in growth plate cartilage. Longitudinal sections of day 19 chick embryonic tibia growth plate cartilage were double stained with antibodies against type X (A) and I collagen (B) or antibodies against annexin V (C). Sections derived from similar areas were stained with alizarin red S (D). Double staining demonstrated a colocalization of type X (A) and type I collagen (B) in the lower hypertrophic cartilage zone. Type I collagen staining was detected in 3–5 cell layers close to the chondro–osseous junction (arrows). Alizarin red S staining confirmed that these type I collagen-positive cartilage regions were calcified (D, arrow). Immunostaining with antibodies against annexin V revealed strong staining of the matrix only in the lower hypertrophic (calcified) cartilage zone, while staining for annexin V in hypertrophic cartilage was restricted to the cell surface (C). HZ, hypertrophic zone; MZ, mineralized zone; O, osteoid. Bar, 100 μm.

Similar articles

Cited by

References

    1. Adams SL, Pallante KM, Niu Z, Leboy PS, Golden EB, Pacifici M. Rapid induction of type X collagen gene expression in cultured chick vertebral chondrocytes. Exp Cell Res. 1991;193:190–197. - PubMed
    1. Ali SY. Analysis of matrix vesicles and their role in the calcification of epiphyseal cartilage. Fed Proc. 1976;35:135–142. - PubMed
    1. Ali SY. New knowledge of osteoarthritis. J Clin Pathol (Lond) 1992;178:205–213.
    1. Ames BN. Assay of inorganic phosphate, total phosphate and phosphatases. Methods Enzymol. 1966;8:115–118.
    1. Anderson HC. Vesicles associated with calcification in the matrix of epiphyseal cartilage. J Cell Biol. 1969;41:59–72. - PMC - PubMed

Publication types

MeSH terms