CCR5 levels and expression pattern correlate with infectability by macrophage-tropic HIV-1, in vitro
- PMID: 9151905
- PMCID: PMC2196298
- DOI: 10.1084/jem.185.9.1681
CCR5 levels and expression pattern correlate with infectability by macrophage-tropic HIV-1, in vitro
Abstract
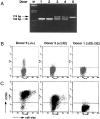
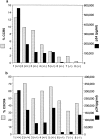
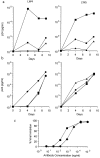
Chemokine receptors serve as coreceptors for HIV entry into CD4+ cells. Their expression is thought to determine the tropism of viral strains for different cell types, and also to influence susceptibility to infection and rates of disease progression. Of the chemokine receptors, CCR5 is the most important for viral transmission, since CCR5 is the principal receptor for primary, macrophage-tropic viruses, and individuals homozygous for a defective CCR5 allele (delta32/delta32) are highly resistant to infection with HIV-1. In this study, CCR5-specific mAbs were generated using transfectants expressing high levels of CCR5. The specificity of these mAbs was confirmed using a broad panel of chemokine receptor transfectants, and by their non-reactivity with T cells from delta32/delta32 individuals. CCR5 showed a distinct pattern of expression, being abundant on long-term activated, IL-2-stimulated T cells, on a subset of effector/memory T cells in blood, and on tissue macrophages. A comparison of normal and CCR5 delta32 heterozygotes revealed markedly reduced expression of CCR5 on T cells from the heterozygotes. There was considerable individual to individual variability in the expression of CCR5 on blood T cells, that related to factors other than CCR5 genotype. Low expression of CCR5 correlated with the reduced infectability of T cells with macrophage-tropic HIV-1, in vitro. Anti-CCR5 mAbs inhibited the infection of PBMC by macrophage-tropic HIV-1 in vitro, but did not inhibit infection by T cell-tropic virus. Anti-CCR5 mAbs were poor inhibitors of chemokine binding, indicating that HIV-1 and ligands bind to separate, but overlapping regions of CCR5. These results illustrate many of the important biological features of CCR5, and demonstrate the feasibility of blocking macrophage-tropic HIV-1 entry into cells with an anti-CCR5 reagent.
Figures


Similar articles
-
The HIV coreceptors CXCR4 and CCR5 are differentially expressed and regulated on human T lymphocytes.Proc Natl Acad Sci U S A. 1997 Mar 4;94(5):1925-30. doi: 10.1073/pnas.94.5.1925. Proc Natl Acad Sci U S A. 1997. PMID: 9050881 Free PMC article.
-
Primary, syncytium-inducing human immunodeficiency virus type 1 isolates are dual-tropic and most can use either Lestr or CCR5 as coreceptors for virus entry.J Virol. 1996 Dec;70(12):8355-60. doi: 10.1128/JVI.70.12.8355-8360.1996. J Virol. 1996. PMID: 8970955 Free PMC article.
-
Role of CCR5 in infection of primary macrophages and lymphocytes by macrophage-tropic strains of human immunodeficiency virus: resistance to patient-derived and prototype isolates resulting from the delta ccr5 mutation.J Virol. 1997 Apr;71(4):3219-27. doi: 10.1128/JVI.71.4.3219-3227.1997. J Virol. 1997. PMID: 9060685 Free PMC article.
-
[Deep lung--cellular reaction to HIV].Rev Port Pneumol. 2007 Mar-Apr;13(2):175-212. Rev Port Pneumol. 2007. PMID: 17492233 Review. Portuguese.
-
Chemokine receptors as HIV-1 coreceptors: roles in viral entry, tropism, and disease.Annu Rev Immunol. 1999;17:657-700. doi: 10.1146/annurev.immunol.17.1.657. Annu Rev Immunol. 1999. PMID: 10358771 Review.
Cited by
-
Dendritic cell dysregulation during HIV-1 infection.Immunol Rev. 2013 Jul;254(1):170-89. doi: 10.1111/imr.12082. Immunol Rev. 2013. PMID: 23772620 Free PMC article. Review.
-
Modeling the Effects of Morphine on Simian Immunodeficiency Virus Dynamics.PLoS Comput Biol. 2016 Sep 26;12(9):e1005127. doi: 10.1371/journal.pcbi.1005127. eCollection 2016 Sep. PLoS Comput Biol. 2016. PMID: 27668463 Free PMC article.
-
CCR5 receptor antagonists in preclinical to phase II clinical development for treatment of HIV.Expert Opin Investig Drugs. 2016 Dec;25(12):1377-1392. doi: 10.1080/13543784.2016.1254615. Expert Opin Investig Drugs. 2016. PMID: 27791451 Free PMC article. Review.
-
Transmitted/founder and chronic subtype C HIV-1 use CD4 and CCR5 receptors with equal efficiency and are not inhibited by blocking the integrin α4β7.PLoS Pathog. 2012;8(5):e1002686. doi: 10.1371/journal.ppat.1002686. Epub 2012 May 31. PLoS Pathog. 2012. PMID: 22693444 Free PMC article.
-
Bovine immunodeficiency virus expression in vitro is reduced in the presence of beta-chemokines, MIP-1alpha, MIP-1beta and RANTES.Vet Res Commun. 2002 Apr;26(3):239-50. doi: 10.1023/a:1015209806058. Vet Res Commun. 2002. PMID: 12090295
References
-
- Baggiolini M, Dewald B, Moser B. IL-8 and related chemotactic cytokines-CXC and CC chemokines. Adv Immunol. 1994;55:97–179. - PubMed
-
- Murphy PM. The molecular biology of leukocyte chemoattractant receptors. Annu Rev Immunol. 1994;12:593–633. - PubMed
-
- Schall TJ, Bacon KB. Chemokines, leukocyte trafficking, and inflammation. Curr Opin Immunol. 1994;6:865–873. - PubMed
-
- Gerard C, Gerard NP. The pro-inflammatory seven-transmembrane segment receptors of the leukocyte. Curr Opin Immunol. 1994;6:140–145. - PubMed
-
- Springer TA. Traffic signals for lymphocyte recirculation and leukocyte emigration: the multistep paradigm. Cell. 1994;76:301–314. - PubMed
Publication types
MeSH terms
Substances
Grants and funding
LinkOut - more resources
Full Text Sources
Other Literature Sources
Research Materials

