. 1997 Apr 21;137(2):387-98.
doi: 10.1083/jcb.137.2.387.

Regulated membrane localization of Tiam1, mediated by the NH2-terminal pleckstrin homology domain, is required for Rac-dependent membrane ruffling and C-Jun NH2-terminal kinase activation

Affiliations

Regulated membrane localization of Tiam1, mediated by the NH2-terminal pleckstrin homology domain, is required for Rac-dependent membrane ruffling and C-Jun NH2-terminal kinase activation

F Michiels et al. J Cell Biol. .

Abstract

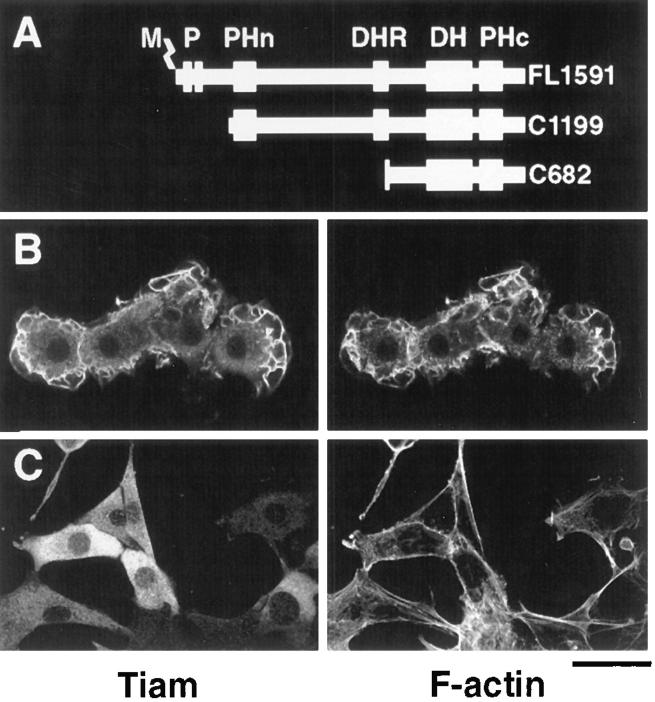
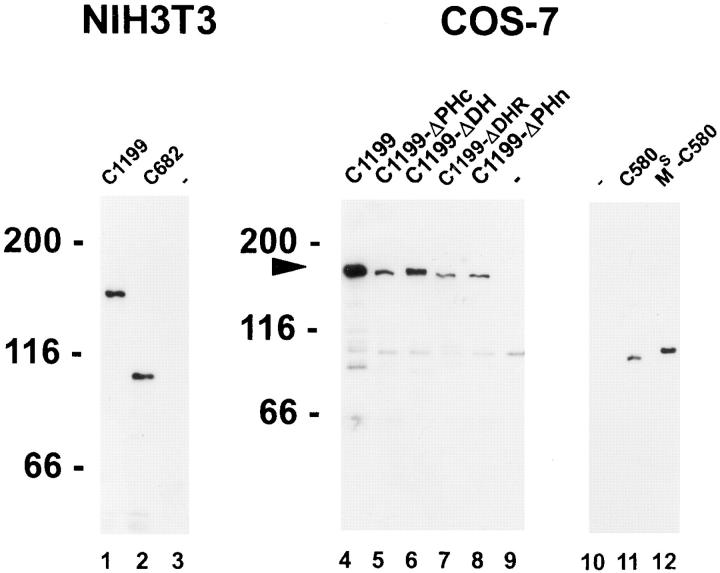
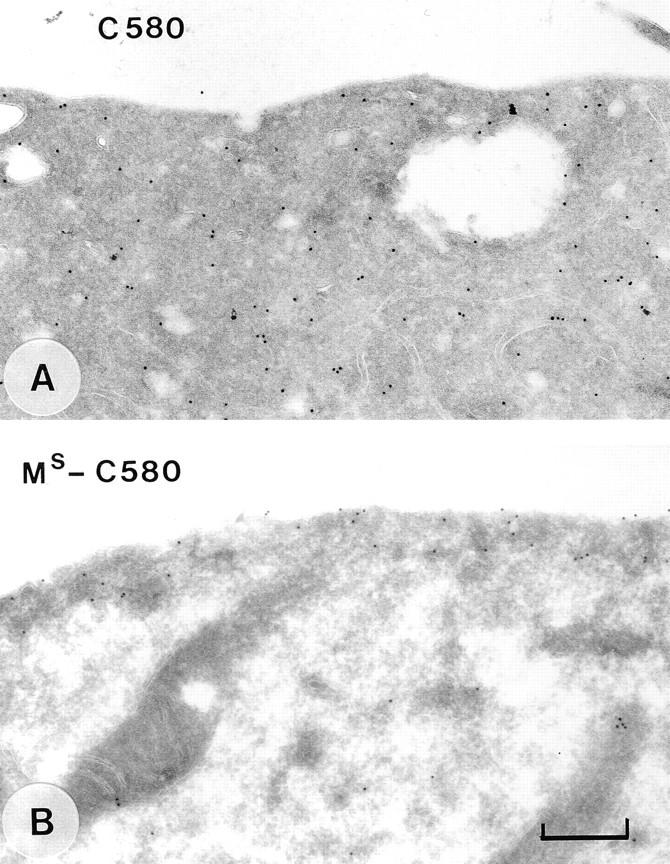
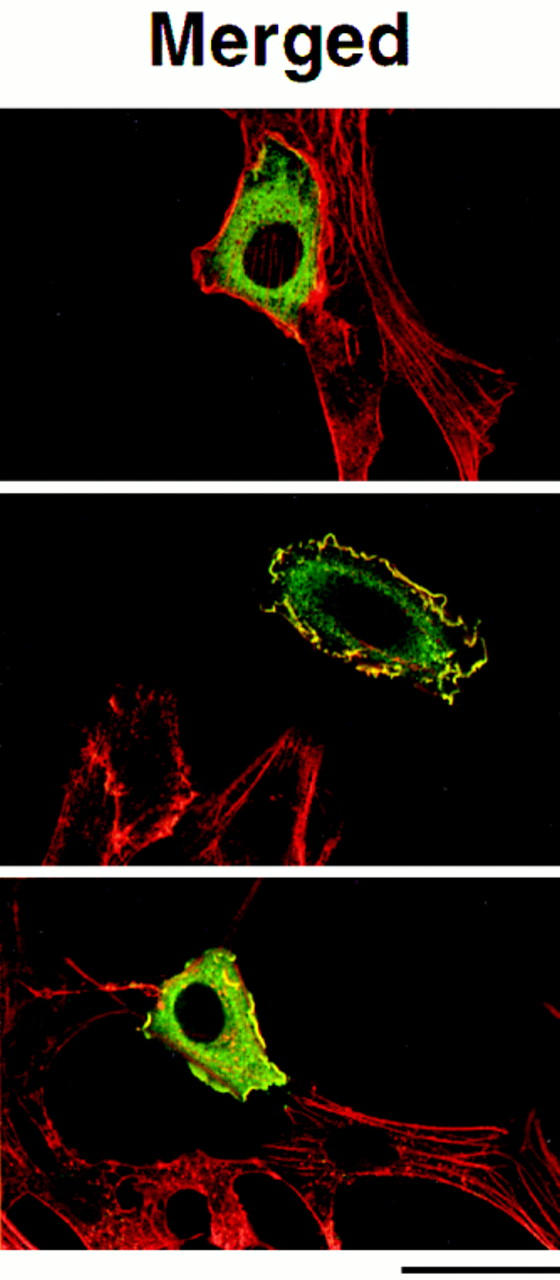
Rho-like GTPases, including Cdc42, Rac, and Rho, regulate signaling pathways that control actin cytoskeletal structures and transcriptional activation. The Tiam1 gene encodes an activator of Rac1, and similarly to constitutively activated (V12)Rac1, overexpression of Tiam1 in fibroblasts induces the formation of membrane ruffles. Tiam1 contains a Dbl homology (DH) domain and adjacent pleckstrin homology (PH) domain, hallmarks for activators of Rho-like GTPases. Unique for Tiam1 are an additional PH domain and a Discs-large homology region in the NH2-terminal part of the protein. Here we show that both in fibroblasts and COS cells, membrane localization of Tiam1 is required for the induction of membrane ruffling. A detailed mutational analysis, in combination with confocal laser scanning microscopy and immunoelectron microscopy, demonstrates that the NH2-terminal PH domain of Tiam1, but not the DH-adjacent PH domain, is essential for membrane association. This NH2-terminal PH domain of Tiam1 can be functionally replaced by the myristoylated membrane localization domain of c-Src, indicating that the primary function of this PH domain is to localize the protein at the membrane. After serum starvation, both membrane association of Tiam1 and ruffling can be induced by serum, suggesting that receptor stimulation induces membrane translocation of Tiam1. Similar to V12Rac1, Tiam1 stimulates the activity of the c-Jun NH2-terminal kinase (JNK). This Rac-dependent stimulation of JNK also requires membrane association of Tiam1. We conclude that the regulated membrane localization of Tiam1 through its NH2-terminal PH domain determines the activation of distinct Rac-mediated signaling pathways.


Figures

Figure 1
Figure 1
Confocal images of NIH3T3 cells expressing truncated Tiam1 proteins. A depicts the Tiam1 constructs encoding the COOH-terminal 1,199 amino acids (C1199) or 682 amino acids (C682) that were used for transfection of NIH3T3 cells, in comparison to the full-length Tiam1 protein (FL1591). Established cell lines that express the C1199 Tiam1 protein (B) or the C682 Tiam1 protein (C) were fixed and stained with anti-Tiam1 antibodies (Habets et al., 1994), followed by FITC-coupled secondary antibodies (left) and by TRITC-labeled phalloidin for F-actin (right). Note the prominent membrane ruffling in cells that express the C1199 Tiam1 protein. Stress fibers are hardly visible in these cells, since the optical sections were made through the upper half of the cells to reveal the presence or absence of membrane ruffling. No significant differences were found in the amount or appearance of stress fibers between Tiam1-expressing cells and controls. M, myristoylation signal; P, PEST regions; PHn and PHc, NH2-terminal and COOH-terminal pleckstrin homology domains. Magnification is 250×. Bar, 40 μm.
Figure 4
Figure 4
Immunoblotting of mutant Tiam1 proteins. Cell lysates were separated on a 7.5% SDS-polyacrylamide gel and blotted to nitrocellulose. All mutant C1199 and C682 Tiam1 proteins were detected with a polyclonal anti-Tiam1 antibody (Habets et al., 1994). Mutant C580 Tiam1 proteins were detected with a monoclonal antibody against the HA-tag (12CA5). Proteins were visualized using enhanced chemiluminescence (Amersham Corp.). Molecular mass markers (in kD) are shown. The arrow indicates the position of the mutant C1199 Tiam1 proteins.
Figure 2
Figure 2
Immunoelectron microscopic localization of truncated Tiam1 proteins. Frozen sections of established NIH3T3 cell lines expressing either C1199 Tiam1 (A) or C682 Tiam1 (B) were stained with anti-Tiam1 antibodies followed by gold-conjugated secondary antibodies. The C682 Tiam1 protein is almost exclusively located in the cytoplasm, whereas the C1199 Tiam1 protein is also present at the plasma membrane and in the membrane ruffles. Bar, 400 nm.
Figure 3
Figure 3
Confocal images of COS-7 cells expressing mutated C1199 Tiam1 proteins. In this figure, the first column depicts the mutant Tiam1 proteins that were used. The second column shows the FITC-staining for Tiam1 expression. The third column shows the TRITClabeled phalloidin staining for F-actin, while the merged images of Tiam1 (green) and F-actin (red) are shown in the fourth column. Colocalization appears in yellow. Deletions within the conserved domains are indicated by arrowheads. See Materials and Methods section for a description of the mutations. For abbreviations, see legend to Fig. 1. Magnification is 200×. Bar, 40 μm.
Figure 3
Figure 3
Confocal images of COS-7 cells expressing mutated C1199 Tiam1 proteins. In this figure, the first column depicts the mutant Tiam1 proteins that were used. The second column shows the FITC-staining for Tiam1 expression. The third column shows the TRITClabeled phalloidin staining for F-actin, while the merged images of Tiam1 (green) and F-actin (red) are shown in the fourth column. Colocalization appears in yellow. Deletions within the conserved domains are indicated by arrowheads. See Materials and Methods section for a description of the mutations. For abbreviations, see legend to Fig. 1. Magnification is 200×. Bar, 40 μm.
Figure 5
Figure 5
Ultrastructural localization of mutant C1199 Tiam1 proteins in COS-7 cells. Immunogold labeling of mutant C1199 Tiam1 proteins with a deletion in the COOH-terminal PH domain (A), a deletion in the DH domain (B), a deletion in the DHR domain (C), and a deletion in the NH2-terminal PH domain (D). C1199-ΔPHn Tiam1 is almost exclusively localized in the cytoplasm, while other mutant Tiam1 proteins also associate with the plasma membrane. Bar, 400 nm.
Figure 6
Figure 6
Confocal images of COS-7 cells expressing mutant Tiam1 proteins. Confocal laser scanning microscopic images of COS-7 cells expressing C580 Tiam1 (A), MS-C580 Tiam1 (B), full-length Tiam1 (FL1591) (C), full-length Tiam1 with a deletion in the NH2-terminal PH domain (FL-ΔPHn) (D), and FL-ΔPHn containing a Src myristoylation signal at the NH2 terminus (MS-FL-ΔPHn) (E). The insert in E is a higher magnification of the framed region showing the vesicle-like structures that are surrounded by the MS-FL-ΔPHn Tiam1 protein. Indicated in blue is the myristoylation signal from c-Src (MS), containing the NH2-terminal 20 amino acids. In the merged images, Tiam1 is shown in green and F-actin in red. Magnification is 200×. Bar, 40 μm.
Figure 6
Figure 6
Confocal images of COS-7 cells expressing mutant Tiam1 proteins. Confocal laser scanning microscopic images of COS-7 cells expressing C580 Tiam1 (A), MS-C580 Tiam1 (B), full-length Tiam1 (FL1591) (C), full-length Tiam1 with a deletion in the NH2-terminal PH domain (FL-ΔPHn) (D), and FL-ΔPHn containing a Src myristoylation signal at the NH2 terminus (MS-FL-ΔPHn) (E). The insert in E is a higher magnification of the framed region showing the vesicle-like structures that are surrounded by the MS-FL-ΔPHn Tiam1 protein. Indicated in blue is the myristoylation signal from c-Src (MS), containing the NH2-terminal 20 amino acids. In the merged images, Tiam1 is shown in green and F-actin in red. Magnification is 200×. Bar, 40 μm.
Figure 7
Figure 7
Immunoelectron microscopic localization of mutant C580 Tiam1 proteins. Immunogold labeling of transiently transfected COS cells expressing C580 Tiam1 (A) or MS-C580 Tiam1 (B). Note that the MS-C580 Tiam1 protein is located at and underneath the plasma membrane. Bar, 400 nm.
Figure 8
Figure 8
Serum-dependent localization of Tiam1. Confocal images of NIH3T3 cells expressing C1199 Tiam1 (A and B) or MS-C580 Tiam1 (C) proteins. Cells were serum starved for 24 h (A and C), followed by stimulation with serum for 2 h (B). In the merged pictures, Tiam1 proteins are shown in green and F-actin in red. These optical sections were taken at the basal sites of the cells and reveal the presence of stress fibers in serum-starved NIH3T3 cells. Magnification is 300×. (D and E) Immuno-EM localization of C1199 Tiam1 after serum starvation (D) or after readdition of serum for 2 h (E). In F, the distribution of gold particles in at least 40 cross sections of cells were scored and presented as the percentage of cross sections with gold particles being predominantly at the membrane (M) or in the cytoplasm (C). Bars: (A–C) 40 μm; (D and E) 400 nm.
Figure 8
Figure 8
Serum-dependent localization of Tiam1. Confocal images of NIH3T3 cells expressing C1199 Tiam1 (A and B) or MS-C580 Tiam1 (C) proteins. Cells were serum starved for 24 h (A and C), followed by stimulation with serum for 2 h (B). In the merged pictures, Tiam1 proteins are shown in green and F-actin in red. These optical sections were taken at the basal sites of the cells and reveal the presence of stress fibers in serum-starved NIH3T3 cells. Magnification is 300×. (D and E) Immuno-EM localization of C1199 Tiam1 after serum starvation (D) or after readdition of serum for 2 h (E). In F, the distribution of gold particles in at least 40 cross sections of cells were scored and presented as the percentage of cross sections with gold particles being predominantly at the membrane (M) or in the cytoplasm (C). Bars: (A–C) 40 μm; (D and E) 400 nm.
Figure 9
Figure 9
Stimulation of JNK activity by Tiam1. (A) COS-7 cells were transfected with pCMV-Flag-JNK1 and empty vector (pcDNA-neo), full-length Tiam1 (FL1591), or constitutively activated (V12)Rac1. Cotransfection with dominant-negative (N17)Rac1 was performed as indicated. The activity of immunoprecipitated Flag-JNK was determined 48 h after transfection by an in vitro kinase assay using bacterially expressed GST-Jun as a substrate. The expression of Tiam1, Myc-tagged (N17)Rac, and Flag-tagged JNK was analyzed by Western blotting and is shown underneath the graph. (B) NIH3T3 cells were transfected with pCMV-Flag-JNK1 and mutant Tiam1 constructs. JNK activity was determined as described. All data are presented as fold stimulation of empty vector controls. Equal amounts of expressed Flag-JNK1 and Tiam1 proteins, as determined by Western blotting, were used. Data represent mean ± standard deviation of at least two independent experiments.
Figure 10
Figure 10
Model for activation of Rac by Tiam1. Activation of Rac requires membrane translocation of Tiam1 and might be analogous to activation of Ras by receptor-induced translocation of SOS. Membrane association of Tiam1 could be mediated by interactions between the NH2-terminal PH domain and putative effectors of activated G-protein coupled receptors (GPCR), tyrosine kinase receptors (TKR), or Ras, which may include Gβγ subunits, PIP2, PIP3, IP3, and perhaps Gα subunits. Activation of Rac by membrane-associated Tiam1 leads to membrane ruffling and JNK activation. It is unlikely that JNK is involved in the induction of an oncogenic phenotype in NIH3T3 cells, since mutant C682 Tiam1 induces an oncogenic phenotype without activation of JNK. Which Tiam1/Rac-mediated signaling pathways are involved in the induction of an invasive phenotype in T-lymphoma cells remains to be established.

Similar articles

Cited by

References

    1. Adamson P, Paterson HF, Hall A. Intracellular localization of the p21-Rho proteins. J Cell Biol. 1992;119:617–627. - PMC - PubMed
    1. Boguski MS, McCormick F. Proteins regulating Ras and its relatives. Nature (Lond) 1993;366:643–654. - PubMed
    1. Bokoch GM. Regulation of the human neutrophil NADPH oxidase by the Rac GTP-binding proteins. Curr Opin Cell Biol. 1994;6:212–218. - PubMed
    1. Buchsbaum R, Telliez J-P, Goonesekera S, Feig LA. The NH2terminal pleckstrin, coiled-coil, and IQ domains of the exchange factor RasGRF act cooperatively to facilitate activation by calcium. Mol Cell Biol. 1996;16:4888–4896. - PMC - PubMed
    1. Cerione RA, Zheng Y. The Dbl family of oncogenes. Curr Opin Cell Biol. 1996;8:216–222. - PubMed

Publication types

MeSH terms

Substances