. 1997 Apr 7;137(1):5-18.
doi: 10.1083/jcb.137.1.5.

Telomeres cluster de novo before the initiation of synapsis: a three-dimensional spatial analysis of telomere positions before and during meiotic prophase

Affiliations

Telomeres cluster de novo before the initiation of synapsis: a three-dimensional spatial analysis of telomere positions before and during meiotic prophase

H W Bass et al. J Cell Biol. .

Abstract

We have analyzed the progressive changes in the spatial distribution of telomeres during meiosis using three-dimensional, high resolution fluorescence microscopy. Fixed meiotic cells of maize (Zea mays L.) were subjected to in situ hybridization under conditions that preserved chromosome structure, allowing identification of stage-dependent changes in telomere arrangements. We found that nuclei at the last somatic prophase before meiosis exhibit a nonrandom, polarized chromosome organization resulting in a loose grouping of telomeres. Quantitative measurements on the spatial arrangements of telomeres revealed that, as cells passed through premeiotic interphase and into leptotene, there was an increase in the frequency of large telomere-to-telomere distances and a decrease in the bias toward peripheral localization of telomeres. By leptotene, there was no obvious evidence of telomere grouping, and the large, singular nucleolus was internally located, nearly concentric with the nucleus. At the end of leptotene, telomeres clustered de novo at the nuclear periphery, coincident with a displacement of the nucleolus to one side. The telomere cluster persisted throughout zygotene and into early pachytene. The nucleolus was adjacent to the cluster at zygotene. At the pachytene stage, telomeres rearranged again by dispersing throughout the nuclear periphery. The stage-dependent changes in telomere arrangements are suggestive of specific, active telomere-associated motility processes with meiotic functions. Thus, the formation of the cluster itself is an early event in the nuclear reorganizations associated with meiosis and may reflect a control point in the initiation of synapsis or crossing over.


Figures

Figure 3
Figure 3
Polarized chromosomes and telomere grouping at the last prophase before meiosis. 3-dimensional telomere FISH was carried out on acrylamide-embedded cells (see Materials and Methods) from 0.2-mm anthers. Two nuclei at the last prophase before meiosis are shown (A–D, and E–F). To convey the 3-dimensional data in 2-dimensional images, the original data sets (60–80 optical sections each) were converted to a series of four sequential projections each with an effective focal planes of 1/4 the nuclear depth (∼5 microns). The four 1/4 nucleus projections are displayed in sequence to give visual access to the full complement of data in the original data set (A). Pseudocolor overlays showing the DNA (DAPI image, red) and the telomeres (bright dots in the FITC images, green/yellow) for each projection show a loose grouping telomere signals (green dots). (B) A 3-dimensional model of the nucleus in A is shown. The edges of the nucleus (purple wire) and the nucleolus (red wire) are indicated along with the positions of the telomeres (yellow spheres). (C) Volume-rendered projections of the entire nucleus is also shown to convey the overall paths of the chromosomes. The telomere hemisphere (T*) and the presumed centromere hemisphere (C*) are indicated. (D) The axial paths of continuous chromosome were determined and they are individually displayed side by side. (E) A volume-rendered projection of a different nucleus is shown along with the paths of the 12 longest chromosome tracings (F). The tracings in F are rotated clockwise about 10° relative to the projection in E. Each nucleus has a large, singular internal nucleolus (not shown for nucleus in E). Bar, 5 μm.
Figure 2
Figure 2
Specificity of oligonucleotide telomere FISH. A partially ruptured and flattened pachytene nucleus following FISH with telomere oligonucleotide probe (see Materials and Methods). Images show the relationship of chromosomes (A, DAPI image) and telomeres signals (B, FITC image), by two-colored overlay (C) with inset enlargement. The nucleolus (n) and some telomeres (t) are indicated. Bars: (A) 5 μm; (inset) 1 μm.
Figure 7
Figure 7
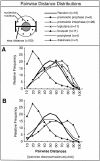
Analysis of the distribution of distances between telomeres. The Euclidean straight-line distances between all the pairs of telomeres were determined for each nucleus and normalized to the maximum distance, generating a distance distribution curve that can be directly compared for nuclei that differ in volume and telomere signal count (see Materials and Methods). The relative frequencies of these distances were binned by increments of 10% of the maximum (see Materials and Methods). These binned normalized pairwise distance values were averaged to yield a single curve for each stage (stage is indicated in the legend at top, n, number of nuclei averaged). The “Random” curve was made from modeled nuclei as described in Materials and Methods, and is plotted for comparison in both graphs (thick line). (A) The distribution of distances for nuclei before and during the bouquet stage. (B) The distribution of distances during and after the bouquet stage.
Figure 8
Figure 8
Analysis of telomere locations within the nuclear volume. Telomeres were scored as being located in the inner or outer half of the nuclear volume (see Materials and Methods). For each stage, all the telomeres were pooled and plotted. The two numbers in parentheses refer to the total number of nuclei pooled (1st number) and the total number of telomeres from those pooled nuclei (2nd number).
Figure 1
Figure 1
Criteria for staging meiocytes after FISH. A summary of the multiple criteria used to determine meiotic stages in maize meiotic is shown, along with DAPI images of representative nuclei (FITC telomere signals not shown). DAPI images are shown as single optical sections (A and B) or projections of optical sections spanning 2–3 microns in the Z dimension (C, D, and E). Each image is from a data stack subvolume originally containing an entire nucleus (see Materials and Methods). Chromatin and chromosome fiber appearances, the most definitive characteristics of meiotic stages, are considered together with anther size, nucleolus position, and knob morphology in classifying individual nuclei. Asterisks (*) indicate those criteria established in part or in full from this study; additional staging criteria are taken in part or in full from the literature (12, 22, 23, 46). Heterochromatic knobs (k), condensed fibers (f), and the position of the nucleolus (n) are indicated. The five conventional stages of the prophase of meiosis I (leptotene, zygotene, pachytene, diplotene, and diakinesis) are indicated at the top. Chromosomes of leptotene, zygotene, and pachytene nuclei are not yet synapsed, partially synapsed, or completely synapsed, respectively. Chromosomes of diplotene and diakinesis have desynapsed and are further condensed. Additionally, premeiotic interphase and prezygotene (Pzt, and see text) are indicated.
Figure 4
Figure 4
Telomere distribution at premeiotic interphase and leptotene. Sequential color overlay projections of four nuclei subjected to telomere FISH are shown for the DAPI (DNA, red) and FITC (telomeres, green) images as described in Fig. 3. (A and B) Two premeiotic interphase nuclei show an internal nucleolus (n) and distributed telomeres (t). Arrows indicate examples of individual telomeres more than one micron from the nuclear periphery. 3-dimensional models (see Materials and Methods) are presented as cross-eyed stereo-pair projections at right showing the edges of the nucleus (purple wire) the nucleolus (red wire), and the telomeres (yellow spheres). (C and D) Two leptotene nuclei also show telomeres distributed throughout the nucleus and an internalized nucleolus. Bar, 5 μm.
Figure 5
Figure 5
Telomere distribution at the bouquet stage. Sequential color overlay projections of four nuclei subjected to telomere FISH are shown for the DAPI (DNA, red) and FITC (telomeres, green) images as described in Fig. 3. (A and B) Nuclei identified to be at the “early bouquet” stage (see Results and Discussion) show clustering of telomeres at the nuclear periphery. The nucleolus (n) is remote from the base of the bouquet (bb) in these early bouquet nuclei. (C and D) Two representative zygotene nuclei show colocalization of the base of the bouquet with the nucleolus (n). Gray scale images of knobs are included (insets with arrows) to illustrate the spherical (A) and elongated (D) shapes of these heterochromatic blocks, features used to stage the nuclei (see text and Fig. 1).
Figure 6
Figure 6
Telomere distribution at pachytene and diakinesis. Sequential color overlay projections of four nuclei subjected to telomere FISH are shown for the DAPI (DNA, red) and FITC (telomeres, green) images as described in Fig. 3. (A–C) Examples of pachytene nuclei identified as early pachytene (A), middle pachytene (B), and late pachytene (C) are shown. (D) The bivalents of a diakinesis have widely separated homologous telomeres (double arrows), reflecting the desynapsis of homologues. In all cases the nucleolus is seen to be peripherally located, but less common examples of an internal nucleolus at late pachytene and diakinesis have been observed (not shown).
Figure 9
Figure 9
Diagram of the timing of meiotic telomere clustering. A summary of the fine scale timing of events associated with the onset of synapsis is presented based on the observations from this work and from Dawe et al. (1994). Leptotene telomeres (legend at right) are shown as either NOR-associated (open circles) or non-NOR (closed circles, representing the other 38 of 40 maize telomeres) are scattered throughout the chromatin, and the nucleolus is fully internal and approximately concentric with the nucleus. The first signs of telomere rearrangements give rise to the “early bouquet” (see text). The early bouquet nucleus (as in Fig. 5, A and B) is first seen at the end of leptotene, just preceding prezygotene. Next, prezygotene occurs, comprising the major transition between leptotene and zygotene as described (12). By zygotene, all of the telomeres are at the cluster site resulting in the eccentric nucleolus showing an obligatory colocalization with the telomere cluster (as in Fig. 5, C and D). At pachytene the telomere bouquet disperses and the paired homologous telomeres remain at the nuclear periphery.
Figure 10
Figure 10
Model of possible mechanisms of telomere cluster formation. The de novo clustering of randomly distributed telomeres is proposed to occur by one of two different mechanisms (1 and 2). Mechanism 1 proposes a two-step model; 1A, telomeres move from their positions in the nucleus to the nuclear envelope where they become attached, and 1B nuclear envelope-attached telomeres move over the nuclear surface to the final cluster site. Mechanism 2 proposes a one-step model in which telomeres move from their positions in the nucleus directly to the region of the nuclear envelope that will be the final cluster site.

Similar articles

Cited by

References

    1. Bahler J, Wyler T, Loidl J, Kohli J. Unusual nuclear structures in meiotic prophase of fission yeast: a cytological analysis. J Cell Biol. 1993;121:241–256. - PMC - PubMed
    1. Belmont AS, Sedat JW, Agard DA. A three-approach to mitotic chromosome structure: evidence for a complex hierarchical organization. J Cell Biol. 1987;105:77–92. - PMC - PubMed
    1. Bennett MD, Smith JB, Heslop-Harrison JS. Nuclear DNA amounts in angiosperms. Proc R Soc Lond Ser B. 1983;216:179–199. - PubMed
    1. Burnham CR, Stout JT, Weinheimer WH, Knowles RV, Phillips RL. Chromosome pairing in maize. Genetics. 1972;71:111–125. - PMC - PubMed
    1. Burns JA. Preleptotene chromosome contraction in Nicotianaspecies. J Hered. 1972;63:175–178.

Publication types