Comparative Study
. 1997 Mar 24;136(6):1271-86.
doi: 10.1083/jcb.136.6.1271.

Inactivation of two Dictyostelium discoideum genes, DdPIK1 and DdPIK2, encoding proteins related to mammalian phosphatidylinositide 3-kinases, results in defects in endocytosis, lysosome to postlysosome transport, and actin cytoskeleton organization

Affiliations
Comparative Study

Inactivation of two Dictyostelium discoideum genes, DdPIK1 and DdPIK2, encoding proteins related to mammalian phosphatidylinositide 3-kinases, results in defects in endocytosis, lysosome to postlysosome transport, and actin cytoskeleton organization

G Buczynski et al. J Cell Biol. .

Abstract

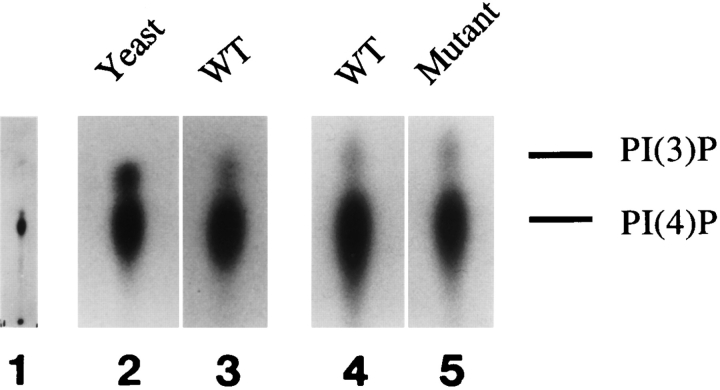
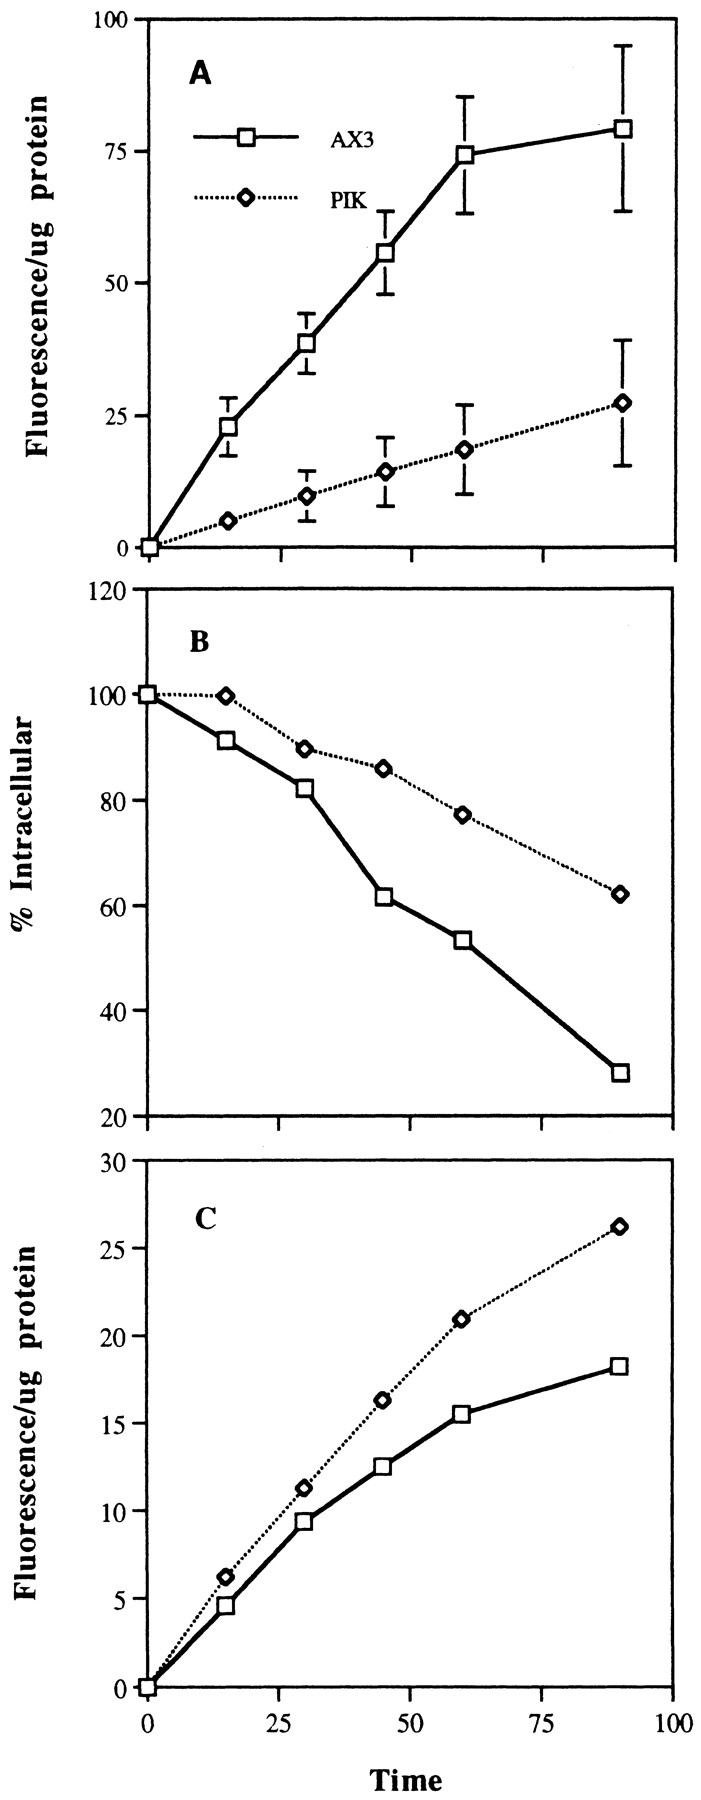
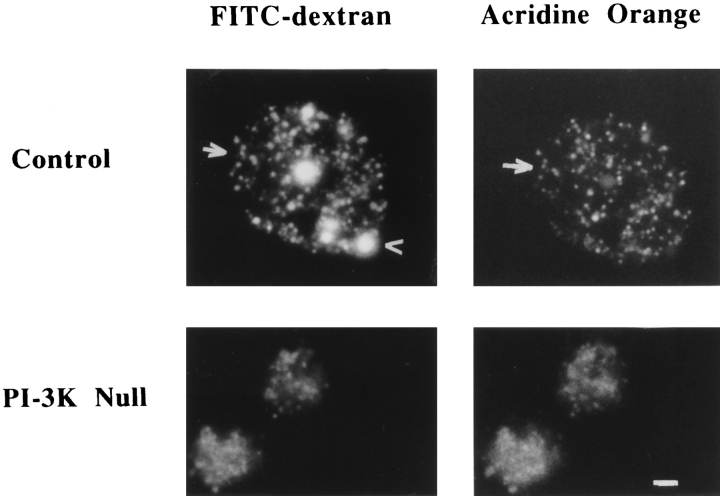
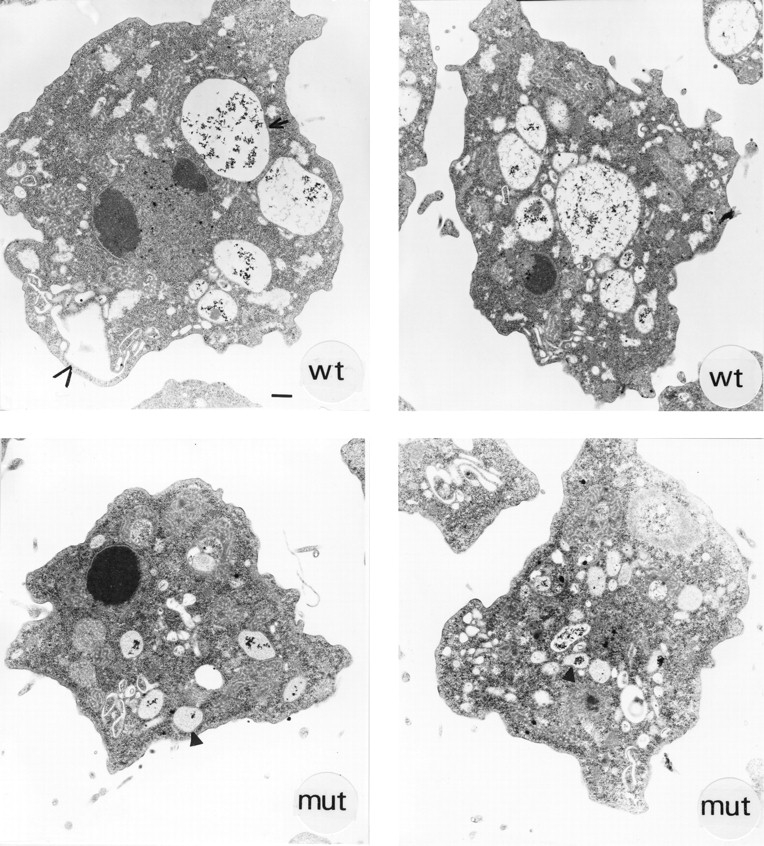
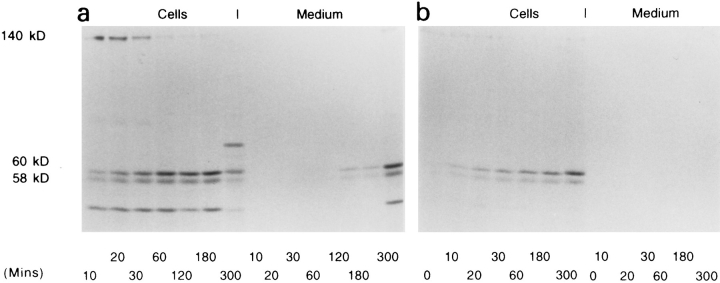
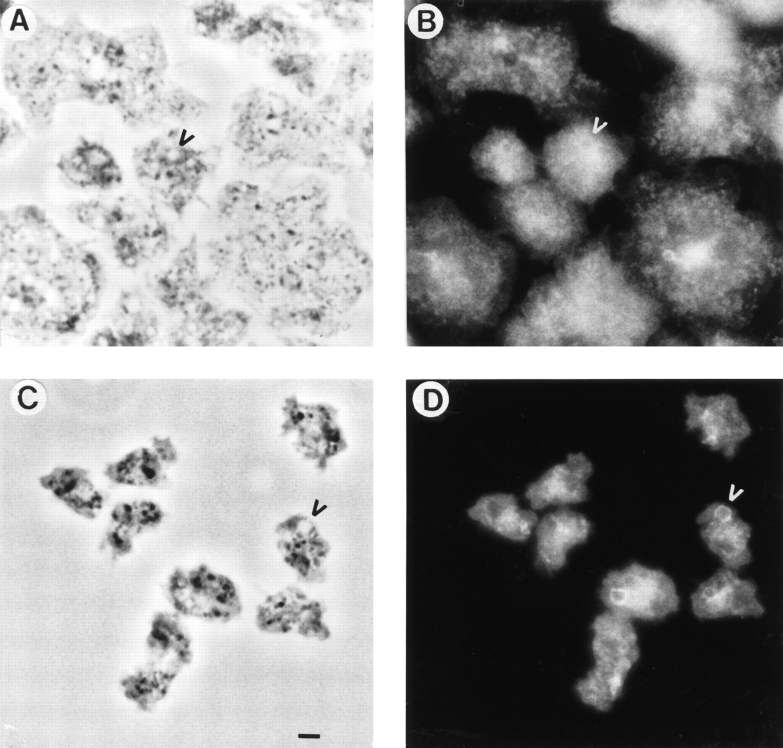
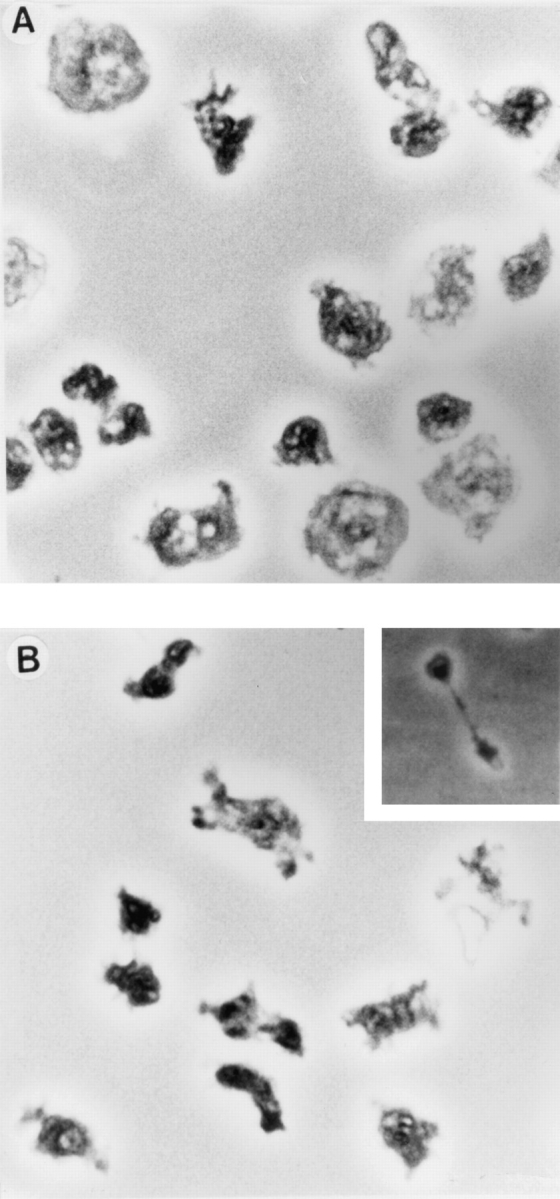
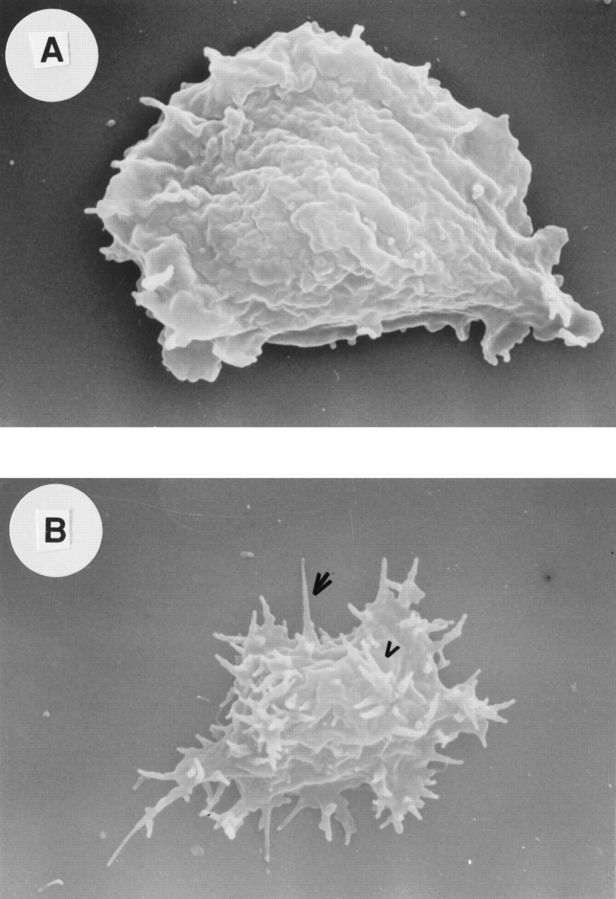
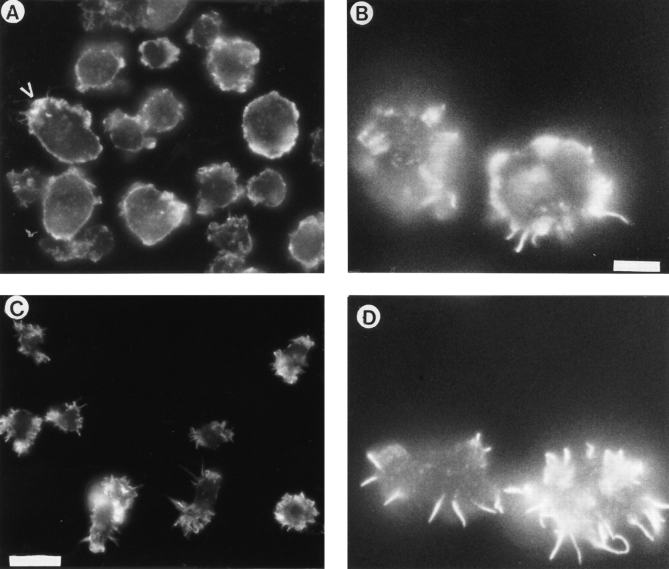
Phosphatidylinositide 3-kinases (PI3-kinases) have been implicated in controlling cell proliferation, actin cytoskeleton organization, and the regulation of vesicle trafficking between intracellular organelles. There are at least three genes in Dictyostelium discoideum. DdPIK1, DdPIK2, and DdPIK3, encoding proteins most closely related to the mammalian 110-kD PI-3 kinase in amino acid sequence within the kinase domain. A mutant disrupted in DdPIK1 and DdPIK2 (delta ddpik1/ddpik2) grows slowly in liquid medium. Using FITC-dextran (FD) as a fluid phase marker, we determined that the mutant strain was impaired in pinocytosis but normal in phagocytosis of beads or bacteria. Microscopic and biochemical approaches indicated that the transport rate of fluid-phase from acidic lysosomes to non-acidic postlysosomal vacuoles was reduced in mutant cells resulting in a reduction in efflux of fluid phase. Mutant cells were also almost completely devoid of large postlysosomal vacuoles as determined by transmission EM. However, delta ddpik1/ddpik2 cells functioned normally in the regulation of other membrane traffic. For instance, radiolabel pulse-chase experiments indicated that the transport rates along the secretory pathway and the sorting efficiency of the lysosomal enzyme alpha-mannosidase were normal in the mutant strain. Furthermore, the contractile vacuole network of membranes (probably connected to the endosomal pathway by membrane traffic) was functionally and morphologically normal in mutant cells. Light microscopy revealed that delta ddpik1/ddpik2 cells appeared smaller and more irregularly shaped than wild-type cells; 1-3% of the mutant cells were also connected by a thin cytoplasmic bridge. Scanning EM indicated that the mutant cells contained numerous filopodia projecting laterally and vertically from the cell surface, and fluorescent microscopy indicated that these filopodia were enriched in F-actin which accumulated in a cortical pattern in control cells. Finally, delta ddpik1/ddpik2 cells responded and moved more rapidly towards cAMP. Together, these results suggest that Dictyostelium DdPIK1 and DdPIK2 gene products regulate multiple steps in the endosomal pathway, and function in the regulation of cell shape and movement perhaps through changes in actin organization.


Figures

Figure 1
Figure 1
The functional levels of PI 3-kinase and PI 4-kinase are identical in Δddpik1/ddpik2 and wild-type cells. The levels of PI kinases were measured in vitro as described in the Materials and Methods section.
Figure 2
Figure 2
Endocytosis and exocytosis of fluid phase are reduced in Δddpik1/ddpik2 phagocytosis is normal. Influx, efflux, and phagocytosis measurements were done as described in Materials and Methods. (A) Cells were centrifuged and resuspended in growth media containing FD at 2 mg/ml. At the times indicated, 1 ml of cells were removed, washed twice with growth medium, and once with buffered 100 mM sucrose. The cells were lysed with Triton X-100 and the fluorescence measured as described in the Materials and Methods section. (B) Cells were allowed to internalize FD for 3 h, washed, and resuspended in fresh growth medium. At the times indicated in the figure, cells were collected by centrifugation, washed and lysed in Triton X-100. The percent of FD that was retained within the cells was calculated by dividing the intracellular fluorescence measurement at the time indicated by the fluorescence measurement at 0 min. Symbols are described above. (C) Cells were centrifuged and resuspended in growth medium containing 1 micron crimson beads. At the times indicated in the figure, cells were collected, washed, and lysed in Triton X-100 and fluorescence measurements were made at Ex 625 nm and an Em 645 nm.
Figure 3
Figure 3
FD accumulates in mutant cells in small lysosome-like vesicles. Control and mutant cells were loaded with FD for 3 h; cells were removed, washed, and placed on ice. Acridine orange (AO) was added for 10 min and cells were subsequently viewed in a fluorescent microscope using the appropriate filters to visualize only fluorescein or acridine orange fluorescence. The closed arrow indicates FD/AO positive lysosomes and the open arrowhead points to a FD positive, AO negative postlysosomal vacuole in wild-type cells. The bar is equivalent to 2 μm.
Figure 4
Figure 4
Δddpik1/ddpik2 cells lack large postlysosomal vacuoles. Cells were fed iron dextran for 2 h and processed for thin section electron microscopy as described in the Materials and Methods section. Control cells with the contractile vacuole (open arrowhead) and a postlysosome (arrow) indicated. Iron positive vesicles (closed arrowhead) in mutant cells. The bar is equivalent to 1.5 μm.
Figure 5
Figure 5
Processing and sorting of lysosomal α-mannosidase is normal in mutant cells. Control cells (a) and mutant cells (b) were pulsed with 35S-met for 20 minutes, washed and resuspended in fresh growth medium. At the indicated times, α-mannosidase was immunoprecipitated from cells and supernatants, and subjected to SDS-PAGE followed by fluorography.
Figure 6
Figure 6
The contractile vacuole system is morphologically normal in mutant cells. Control (A and B) and mutant cells (C and D) were grown overnight on coverslips and processed for immunofluorescent microscopy (B and D) as described in the Materials and Methods section. Contractile “bladder-like” vacuoles are indicated by open arrowheads. The bar is equivalent to 2.5 μm.
Figure 7
Figure 7
Mutant cells are abnormally shaped and some are attached by thin bridges. Phase contrast microscopy of control (A) and mutant cells (B) grown on plastic. Cellular bridges found only in the mutant cells are indicated by the inset in B.
Figure 8
Figure 8
Scanning electron micrograph of control (A) and mutant cells (B). Lateral filopodia (closed arrowhead) and surface projecting filopodia (open arrowhead) are indicated.
Figure 9
Figure 9
F-Actin distributes differently in mutant cells compared to control cells. Cells were grown overnight on coverslips and processed for fluorescence microscopy as described in the Materials and Methods section. Cortical actin in control cells (A and B) is indicated by an arrowhead. C and D represent mutant cells. A and C represents a 400 magnification and B and D represent a 1,000 magnification. Bars: (A and C) 10 μm; (B and D) 5 μm.
Figure 10
Figure 10
Effect of disruption of ΔDdPIK1/DdPIK2 on chemotaxis towards cAMP. Log phase vegetative cells grown on monolayer on plastic Petri dishes were washed and pulsed with 30 nM cAMP every 6 min for 4 h to maximize the number of cAMP receptors and other components of the aggregation-stage cAMP receptor signal transduction pathway (aggregation-competent cells) (Devreotes et al., 1987; Mann et al., 1994). Cells were then washed and plated at low density in plastic Petri dishes in 12 mM phosphate buffer (pH 6.2) allowed to adhere. 200 μM cAMP was loaded into Eppendorf femtotips and the location of the tip positioned using an Eppendorf micromanipulator. Cells were visualized using a Nikon phase contrast inverted microscope with a 20× (A) or 40× (B and C) objective. Movement of the cells was followed using a time-lapse video microscopy. Individual frames were then grabbed onto a Macintosh computer using NIH image 1.59 and a Scion imaging board. (A) Chemotaxis of wild-type and Δddpik1/ddpik2 cells to cAMP. Images a–f are of Δddpik1/ddpik2 cells and are taken 4 min apart. (B) Movement of Δddpik1/ddpik2 cells toward the pipette tip at higher magnification and lower cell density. The micropipette was inserted and the movement of the cells recorded. Images a–e are taken 1-min apart, compared to 2 min for the wild-type cells. Image f shows the position of a micropipette with cells migrating toward it. Immediately after image f, the micropipette was moved to the right. Image g is 30 s later. Images h and i are 1 min apart after image g. Note that the Δddpik1/ ddpik2 cells have changed shape and initiated movement. (C). Movement of wild-type cells toward the pipette tip at higher magnification at lower density. Images a–e are 2 min apart. Image f is 1.5 min after image e. Image g is 4 min later. Immediately after image g, the micropipette was moved to the left. Image h is 30 s after g and image i is 1.5 min after h.
Figure 10
Figure 10
Effect of disruption of ΔDdPIK1/DdPIK2 on chemotaxis towards cAMP. Log phase vegetative cells grown on monolayer on plastic Petri dishes were washed and pulsed with 30 nM cAMP every 6 min for 4 h to maximize the number of cAMP receptors and other components of the aggregation-stage cAMP receptor signal transduction pathway (aggregation-competent cells) (Devreotes et al., 1987; Mann et al., 1994). Cells were then washed and plated at low density in plastic Petri dishes in 12 mM phosphate buffer (pH 6.2) allowed to adhere. 200 μM cAMP was loaded into Eppendorf femtotips and the location of the tip positioned using an Eppendorf micromanipulator. Cells were visualized using a Nikon phase contrast inverted microscope with a 20× (A) or 40× (B and C) objective. Movement of the cells was followed using a time-lapse video microscopy. Individual frames were then grabbed onto a Macintosh computer using NIH image 1.59 and a Scion imaging board. (A) Chemotaxis of wild-type and Δddpik1/ddpik2 cells to cAMP. Images a–f are of Δddpik1/ddpik2 cells and are taken 4 min apart. (B) Movement of Δddpik1/ddpik2 cells toward the pipette tip at higher magnification and lower cell density. The micropipette was inserted and the movement of the cells recorded. Images a–e are taken 1-min apart, compared to 2 min for the wild-type cells. Image f shows the position of a micropipette with cells migrating toward it. Immediately after image f, the micropipette was moved to the right. Image g is 30 s later. Images h and i are 1 min apart after image g. Note that the Δddpik1/ ddpik2 cells have changed shape and initiated movement. (C). Movement of wild-type cells toward the pipette tip at higher magnification at lower density. Images a–e are 2 min apart. Image f is 1.5 min after image e. Image g is 4 min later. Immediately after image g, the micropipette was moved to the left. Image h is 30 s after g and image i is 1.5 min after h.

Similar articles

Cited by

References

    1. Aley S, Cohn Z, Scott W. Endocytosis in Entamoeba histolytica: evidence for a unique non-acidified compartments. J Exp Med. 1984;160:724–737. - PMC - PubMed
    1. Arcaro A, Wyman M. Wortmannin is a potent phosphatidylinositol 3-kinase inhibitor: the role of phosphatidylinositol 3,4,5 trisphosphate in neutrophil responses. Biochem J. 1993;296:297–301. - PMC - PubMed
    1. Aubry L, Klein G, Martiel J, Satre M. Kinetics of endosomal pH evolution in Dictyostelium discoideumamoebae. J Cell Sci. 1993;105:861–866. - PubMed
    1. Brown W, Dewald D, Emr S, Plutner H, Balch W. Role for phosphatidylinositol 3-kinase in the sorting and transport of newly synthesized lysosomal enzymes in mammalian cells. J Cell Biol. 1995;130:781–796. - PMC - PubMed
    1. Bucci C, Parton R, Mather I, Stunnenberg H, Simons K, Hoflack B, Zerial M. The GTPase Rab 5 functions as a regulatory factor in the early endocytic pathway. Cell. 1992;70:715–728. - PubMed

Publication types

MeSH terms

Substances