

Identification of a novel selD homolog from eukaryotes, bacteria, and archaea: is there an autoregulatory mechanism in selenocysteine metabolism?
- PMID: 8986768
- PMCID: PMC26360
- DOI: 10.1073/pnas.93.26.15086
Identification of a novel selD homolog from eukaryotes, bacteria, and archaea: is there an autoregulatory mechanism in selenocysteine metabolism?
Abstract
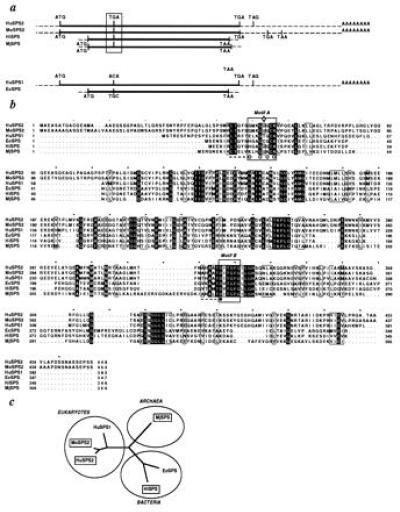
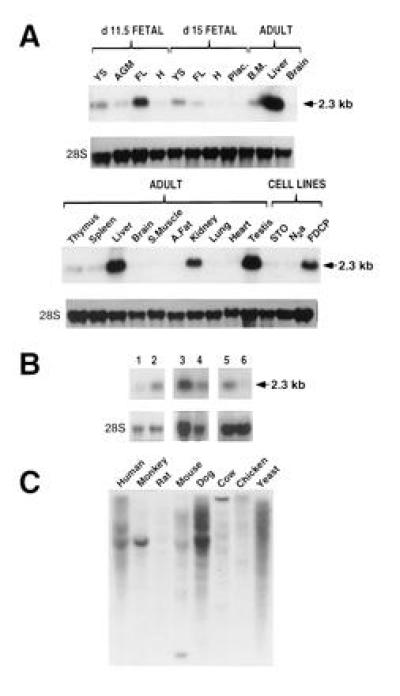
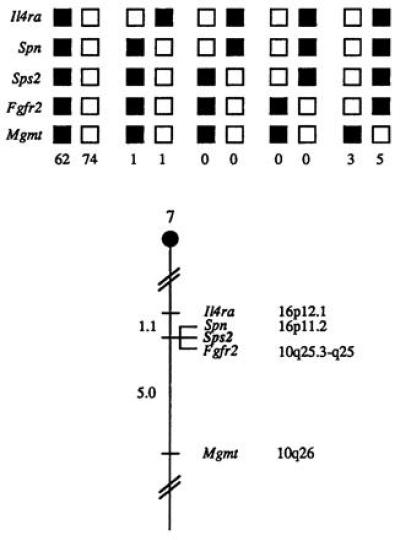
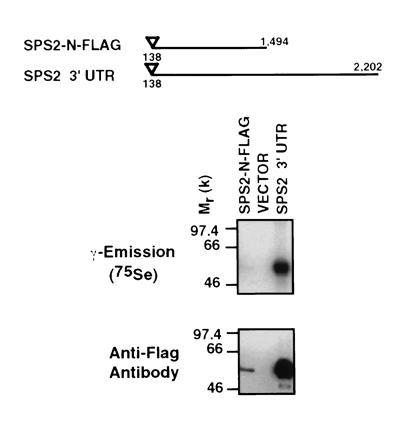
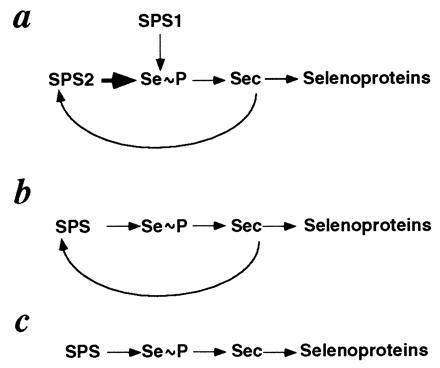
Escherichia coli selenophosphate synthetase (SPS, the selD gene product) catalyzes the production of monoselenophosphate, the selenium donor compound required for synthesis of selenocysteine (Sec) and seleno-tRNAs. We report the molecular cloning of human and mouse homologs of the selD gene, designated Sps2, which contains an in-frame TGA codon at a site corresponding to the enzyme's putative active site. These sequences allow the identification of selD gene homologs in the genomes of the bacterium Haemophilus influenzae and the archaeon Methanococcus jannaschii, which had been previously misinterpreted due to their in-frame TGA codon. Sps2 mRNA levels are elevated in organs previously implicated in the synthesis of selenoproteins and in active sites of blood cell development. In addition, we show that Sps2 mRNA is up-regulated upon activation of T lymphocytes and have mapped the Sps2 gene to mouse chromosome 7. Using the mouse gene isolated from the hematopoietic cell line FDCPmixA4, we devised a construct for protein expression that results in the insertion of a FLAG tag sequence at the N terminus of the SPS2 protein. This strategy allowed us to document the readthrough of the in-frame TGA codon and the incorporation of 75Se into SPS2. These results suggest the existence of an autoregulatory mechanism involving the incorporation of Sec into SPS2 that might be relevant to blood cell biology. This mechanism is likely to have been present in ancient life forms and conserved in a variety of living organisms from all domains of life.
Figures
Similar articles
-
Selenophosphate synthetase genes from lung adenocarcinoma cells: Sps1 for recycling L-selenocysteine and Sps2 for selenite assimilation.Proc Natl Acad Sci U S A. 2004 Nov 16;101(46):16162-7. doi: 10.1073/pnas.0406313101. Epub 2004 Nov 8. Proc Natl Acad Sci U S A. 2004. PMID: 15534230 Free PMC article.
-
Cloning and functional characterization of human selenophosphate synthetase, an essential component of selenoprotein synthesis.J Biol Chem. 1995 Sep 15;270(37):21659-64. doi: 10.1074/jbc.270.37.21659. J Biol Chem. 1995. PMID: 7665581
-
Fetal mouse selenophosphate synthetase 2 (SPS2): biological activities of mutant forms in Escherichia coli.Mol Cells. 1999 Aug 31;9(4):422-8. Mol Cells. 1999. PMID: 10515607
-
Selenoprotein synthesis in archaea.Biofactors. 2001;14(1-4):75-83. doi: 10.1002/biof.5520140111. Biofactors. 2001. PMID: 11568443 Review.
-
The selenophosphate synthetase family: A review.Free Radic Biol Med. 2022 Nov 1;192:63-76. doi: 10.1016/j.freeradbiomed.2022.09.007. Epub 2022 Sep 16. Free Radic Biol Med. 2022. PMID: 36122644 Review.
Cited by
-
Biosynthesis of selenocysteine, the 21st amino acid in the genetic code, and a novel pathway for cysteine biosynthesis.Adv Nutr. 2011 Mar;2(2):122-8. doi: 10.3945/an.110.000265. Epub 2011 Mar 10. Adv Nutr. 2011. PMID: 22332041 Free PMC article. Review.
-
Fate of selenate and selenite metabolized by Rhodobacter sphaeroides.Appl Environ Microbiol. 2000 Nov;66(11):4849-53. doi: 10.1128/AEM.66.11.4849-4853.2000. Appl Environ Microbiol. 2000. PMID: 11055934 Free PMC article.
-
Development of a sensor to detect methylmercury toxicity.Sci Rep. 2024 Sep 18;14(1):21832. doi: 10.1038/s41598-024-72788-z. Sci Rep. 2024. PMID: 39294331 Free PMC article.
-
The methionine sulfoxide reduction system: selenium utilization and methionine sulfoxide reductase enzymes and their functions.Antioxid Redox Signal. 2013 Sep 20;19(9):958-69. doi: 10.1089/ars.2012.5081. Epub 2013 Jan 22. Antioxid Redox Signal. 2013. PMID: 23198996 Free PMC article. Review.
-
Selenium and selenoproteins in prostanoid metabolism and immunity.Crit Rev Biochem Mol Biol. 2019 Dec;54(6):484-516. doi: 10.1080/10409238.2020.1717430. Epub 2020 Jan 30. Crit Rev Biochem Mol Biol. 2019. PMID: 31996052 Free PMC article. Review.
References
-
- Stadtman T C. Annu Rev Biochem. 1996;65:83–100. - PubMed
-
- Stadtman T C. J Biol Chem. 1991;266:16257–16260. - PubMed
-
- Burk R F, Hill K E. Annu Rev Nutr. 1993;13:65–81. - PubMed
-
- Bock A, Forchhammer K, Heider J, Leinfelder W, Sawers G, Veprek B, Zinoni F. Mol Microbiol. 1991;5:515–520. - PubMed
-
- Bock A, Forchhammer K, Heider J, Baron C. Trends Biochem Sci. 1991;16:463–467. - PubMed
Publication types
MeSH terms
Substances
Associated data
- Actions
- Actions
LinkOut - more resources
Full Text Sources
Other Literature Sources
Molecular Biology Databases
