. 1996 Nov 1;16(21):6676-86.
doi: 10.1523/JNEUROSCI.16-21-06676.1996.

Axonal action-potential initiation and Na+ channel densities in the soma and axon initial segment of subicular pyramidal neurons

Affiliations

Axonal action-potential initiation and Na+ channel densities in the soma and axon initial segment of subicular pyramidal neurons

C M Colbert et al. J Neurosci. .

Abstract

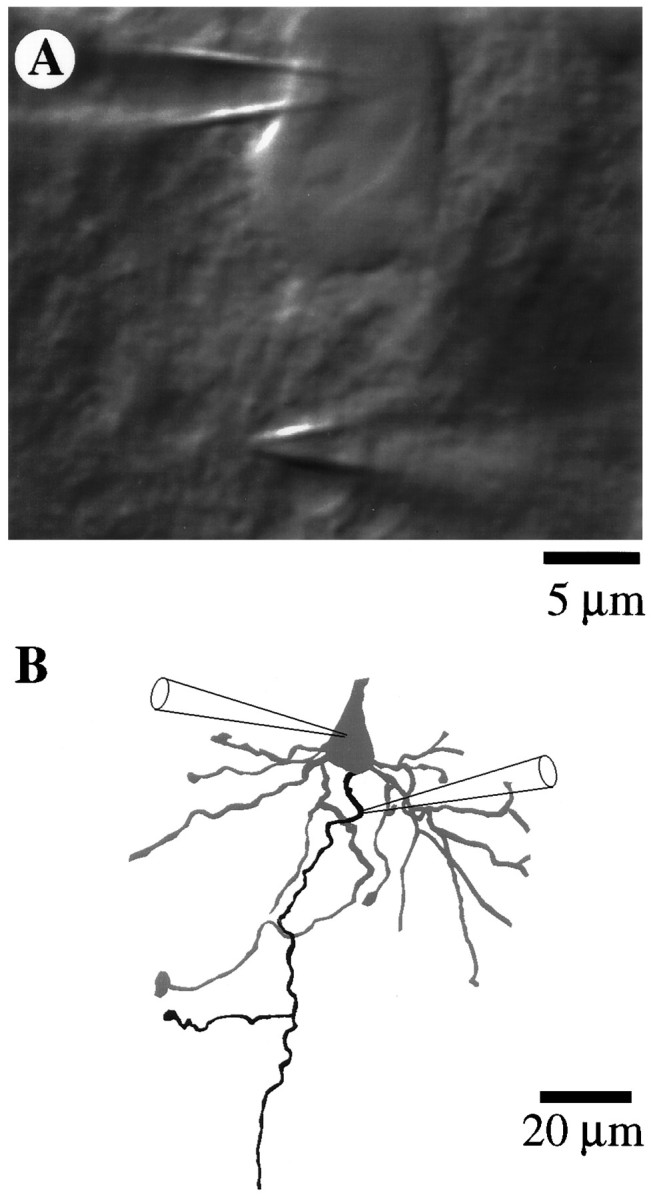
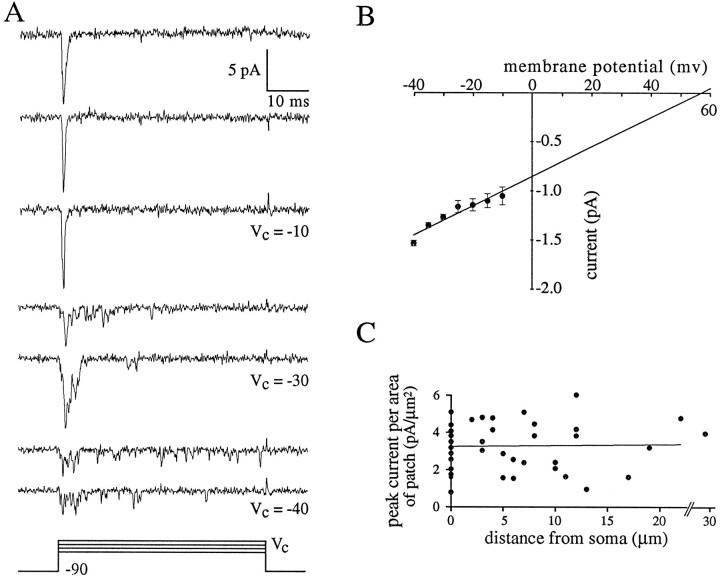
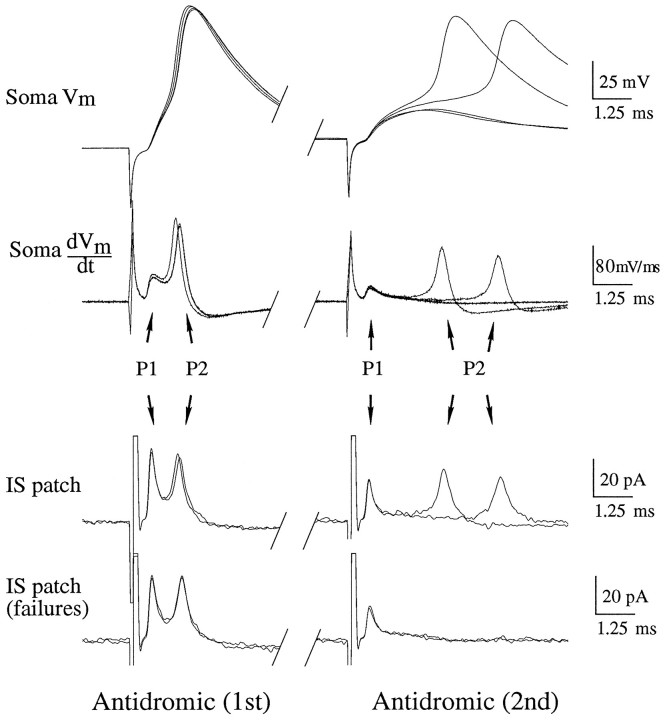
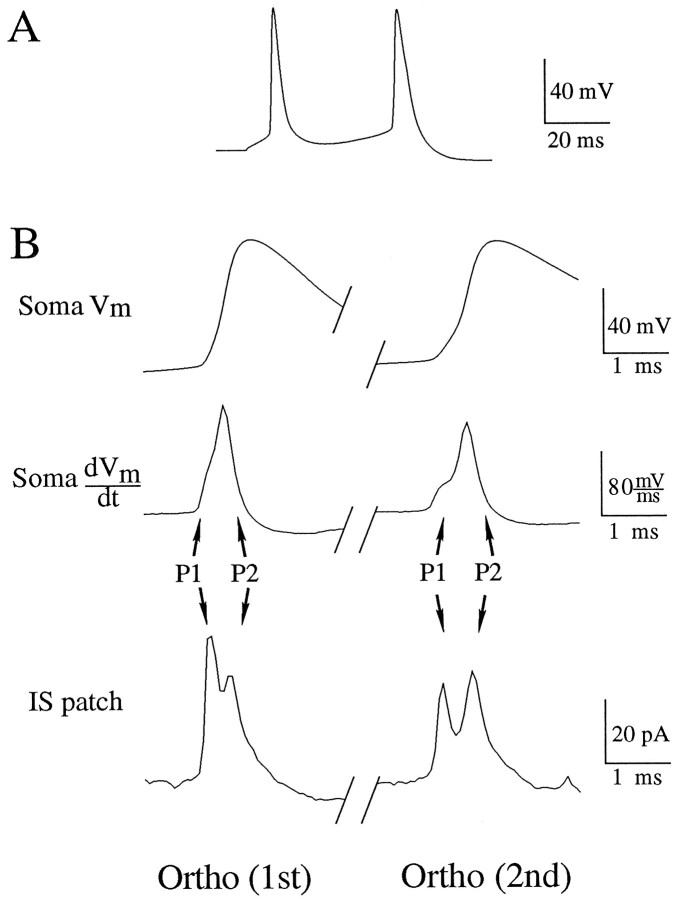
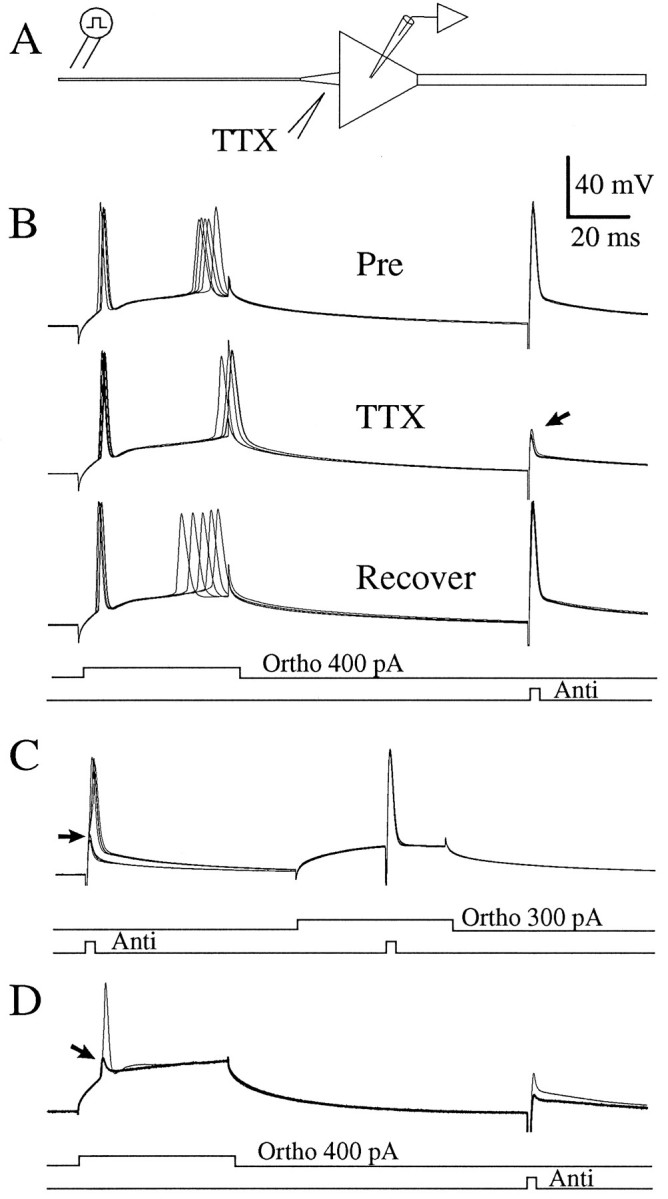
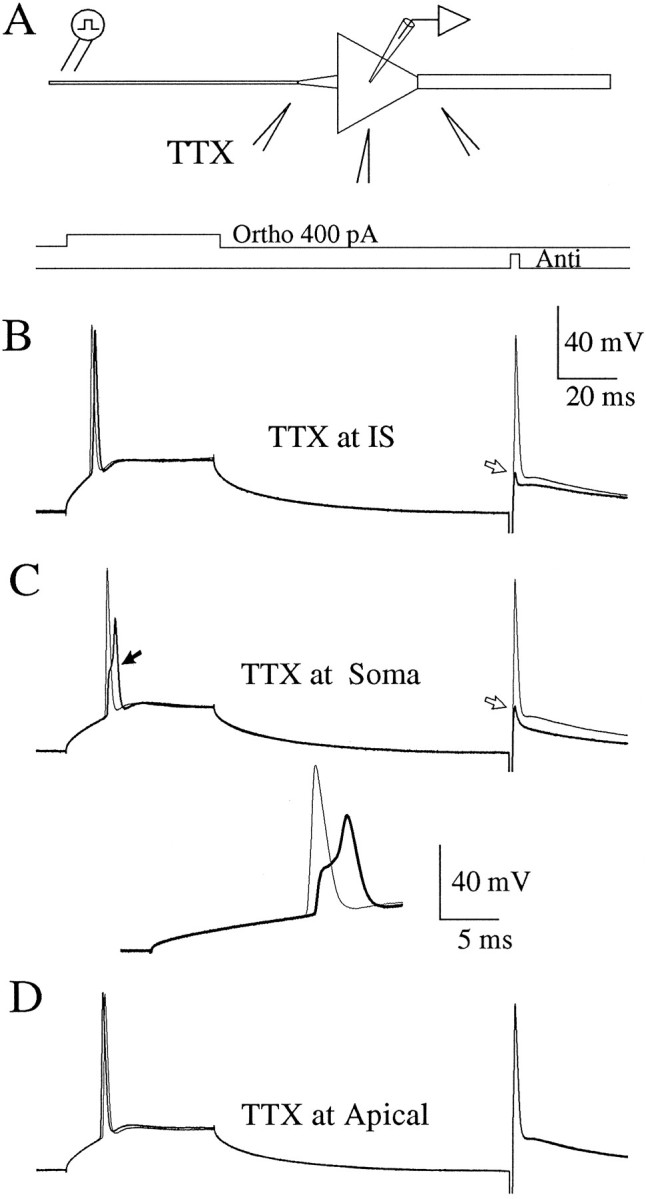
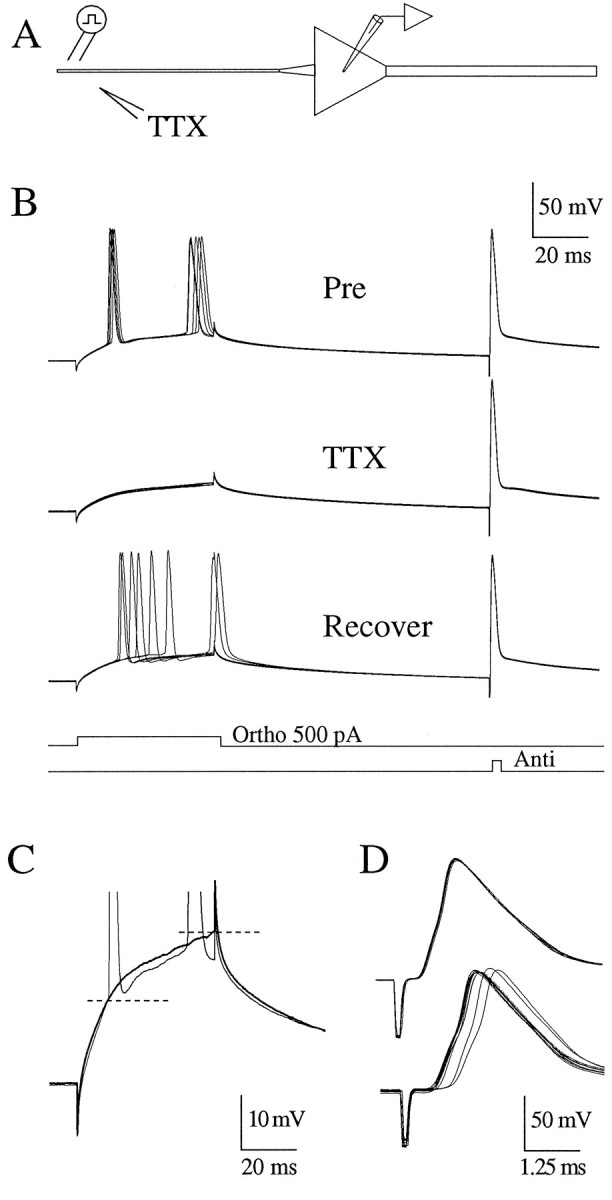
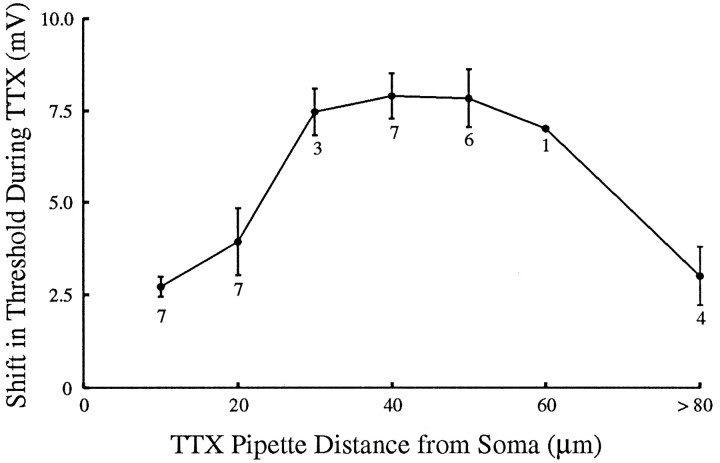
A long-standing hypothesis is that action potentials initiate first in the axon hillock/initial segment (AH-IS) region because of a locally high density of Na+ channels. We tested this idea in subicular pyramidal neurons by using patch-clamp recordings in hippocampal slices. Simultaneous recordings from the soma and IS confirmed that orthodromic action potentials initiated in the axon and then invaded the soma. However, blocking Na+ channels in the AH-IS with locally applied tetrodotoxin (TTX) did not raise the somatic threshold membrane potential for orthodromic spikes. TTX applied to the axon beyond the AH-IS (30-60 microm from the soma) raised the apparent somatic threshold by approximately 8 mV. We estimated the Na+ current density in the AH-IS and somatic membranes by using cell-attached patch-clamp recordings and found similar magnitudes (3-4 pA/microm2). Thus, the present results suggest that orthodromic action potentials initiate in the axon beyond the AH-IS and that the minimum threshold for spike initiation of the neuron is not determined by a high density of Na+ channels in the AH-IS region.


Figures

Fig. 1.
Fig. 1.
Whole-cell patch and cell-attached patch recordings from subicular pyramidal cells. A, Differential interference contrast (DIC) image of soma and initial segment showing the positions of the whole-cell somatic recording electrode (upper right) and the cell-attached initial segment recording electrode (lower right). B, Morphological reconstruction of soma and basal portion of the cell after biocytin filling and subsequent visualization. The identity of the axon (black process) was verified by following its path into the alveus. Cell 95066b.
Fig. 2.
Fig. 2.
Cell-attached recordings from axon initial segment. A, Na+ channel activity after depolarizing steps from −90 to −10, −30, and −40 mV.Traces are individual consecutive sweeps. Note single channel openings throughout the steps to −40 mV. Cell c95064. B, I–V plot of Na+ channel activity. Unitary current amplitudes are plotted as a function of membrane potential. The linear regression crosses the membrane potential axis at +58 mV and has a slope of 14.8 pS. Error bars are SEM. C, Summary of peak Na+ currents in cell-attached patches from initial segment (n = 27) and soma (n = 20). Peak current per area of patch (pA/μm2) is plotted as a function of the distance of the patch from the soma. The points at zero distance correspond to somatic patches. The linear regression line through all points has a slope of 0.018 pA/μm2 per micrometer from soma.
Fig. 3.
Fig. 3.
Sequence of antidromic action-potential (AP) invasion of initial segment (IS) and soma. Dual-recording electrode positions are as in Figure 1. Waveforms are individual sweeps. Antidromic (1st), Leftcolumn shows response to a single antidromic AP. Antidromic (2nd), Rightcolumn is the response to the second of a pair of antidromic APs. Soma Vm, Membrane potential recorded through the somatic whole-cell electrode. Soma dVm/dt, Time derivative of the somatic membrane potential. IS patch, Cell-attached patch recording in the IS. The current recorded is primarily capacitive and, thus, is proportional to the time derivative of the transmembrane potential of the patch. IS patch (failures), Cell-attached recordings in the IS, in which the second antidromic action potential failed to invade the soma. P1 corresponds to the peak in the response attributable to charging of the patch by channels in the IS.P2 corresponds to the charging of the patch by somatic Na+ channels, which does not occur when the second somatic AP fails. See text for details. RMP, −63 mV. Cell c95066a.
Fig. 4.
Fig. 4.
Sequence of orthodromic action-potential (AP) invasion of initial segment (IS) and soma. Dual-recording electrode positions are as in Figure 1. Waveforms are single sweeps.A, Somatic membrane potential recorded through the whole-cell electrode. Orthodromic action potentials were evoked by a 50 msec duration, 200 pA current injection through the recording electrode. B, Ortho (1st), Left column corresponds to the first action potential evoked by the orthodromic stimulus. Ortho (2nd), Right column corresponds to the second action potential initiated by the stimulus. Soma Vm, Membrane potential recorded through the somatic whole-cell electrode. Soma dVm/dt, Time derivative of the somatic membrane potential. IS patch, Cell-attached patch recording in the IS. The current recorded is primarily capacitive and, thus, is proportional to the time derivative of the transmembrane potential of the patch. P1 and P2 correspond to charging of the patch by channels in the initial segment and soma, respectively, as in Figure 3. Note that, although the peaks occur with shorter latency, the sequence of invasion of orthodromic APs is the same as that for antidromic APs. Cell c95066a.
Fig. 5.
Fig. 5.
Local application of TTX to the initial segment (IS) impairs antidromic invasion of the soma without significantly altering the threshold for orthodromic AP initiation.A, A somatic whole-cell electrode recorded from an injected current into the soma. A stimulating electrode in the alveus evoked antidromic APs. TTX was applied to the IS (12 μm from the soma).B, Traces are somatic whole-cell current-clamp records of the response to orthodromic and antidromic APs. Pre, Six consecutive baseline sweeps. TTX, Six consecutive sweeps during TTX application. Note that the antidromic AP failed to invade the soma (arrow), but the orthodromic AP initiated with similar latency and membrane-potential threshold. Recover, Five consecutive sweeps as the cell recovered. C, The full somatic AP was not mediated by Na+ channels in the IS but by somatic Na+ channels. Sweeps with and without TTX are superimposed. In the presence of TTX, the antidromic AP failed to invade the soma (arrow). Pairing subthreshold depolarization with an antidromic AP allowed the soma to fire a full AP. Note that the paired antidromic AP in TTX was indistinguishable from the control condition. Thus, somatic channels were sufficient to produce a full AP. RMP, −63 mV. D, In another cell, a greater ejection of TTX decreased the amplitude of the antidromic AP to ∼10 mV (bold trace). The orthodromic stimulus evoked a similar small spike (arrow) that was insufficient to fire the soma but had the same latency and threshold as APs before the application of TTX. The following sweep (thin trace) had a somewhat larger antidromic AP (25 mV). This greater current from the IS, paired with the depolarization of the soma by the orthodromic stimulus, resulted in a full somatic AP. RMP, −65 mV. Cell c95082.
Fig. 6.
Fig. 6.
Local application of TTX near the soma and apical dendrite does not significantly alter the threshold for AP initiation.A, Experimental configuration as in Figure 5, except that the TTX pipette was placed at the initial segment (12 μm from the soma), the soma, or the apical dendrite (12 μm from the soma). In each of the lower panels, the bold tracecorresponds to the presence of TTX; the thin tracescorrespond to the sweep just before the application of TTX.B, Local application of TTX to the initial segment caused a failure of the antidromic AP (open arrow), without altering the threshold to orthodromic stimuli. C, Local application of TTX to the soma caused a partial block of the somatic AP.Inset shows same sweeps at faster sweep speed. D, Local application of TTX to the apical dendrite had no effect on antidromic or orthodromic AP invasion of the soma. RMP, −65 mV. Cell c95094.
Fig. 7.
Fig. 7.
Local application of TTX to the axon alters the threshold for orthodromic AP initiation. A, Experimental configuration as in Figure 5, except that the TTX pipette was placed near the axon 50 μm from the soma. In each sweep a 500 pA current step through the recording electrode was followed by an antidromic stimulus in the alveus. B, Pre, Five consecutive sweeps before the application of TTX. TTX, Five consecutive sweeps after TTX was applied to the axon. Recover, Six consecutive sweeps during the recovery from the TTX application. Note that the antidromic AP was not altered by the TTX application. C, Single sweeps from B for comparison at increased gain. Application of TTX on the axon increased the apparent threshold for orthodromic AP initiation by at least 10 mV (bold trace). RMP, −61. Cell c95090. D, In another cell, application of TTX to the axon (60 μm from soma) increased the latency of the antidromic action potential. Threshold for the orthodromic AP increased by >10 mV (data not shown). RMP, −63 mV. Cell c95082.
Fig. 8.
Fig. 8.
Shift in threshold for orthodromic action-potential (AP) initiation as a function of the location of TTX application. Experimental configuration is the same as in Figure 7. To control for the spread of TTX and to ensure adequate delivery, TTX ejections at locations 10 and 20 μm from the soma were required to be sufficient to block somatic invasion of the antidromic AP, as in Figure5. TTX ejections beyond 20 μm were required not to block somatic invasion of the antidromic AP. The most effective locations of TTX application seem to be in the axon beyond the initial segment. Error bars are SEM. Numbers under each point are the number of neurons tested with TTX at that distance from the soma.

Similar articles

Cited by

References

    1. Adams PR. The platonic neuron gets the hots. Curr Biol. 1992;2:625–627. - PubMed
    1. Angelides KJ, Elmer LW, Loftus D, Elson E. Distribution and lateral mobility of voltage-dependent sodium channels in neurons. J Cell Biol. 1988;106:1911–1924. - PMC - PubMed
    1. Araki T, Otani T. Response of single motoneurons to direct stimulation in toad’s spinal cord. J Neurophysiol. 1955;18:472–485. - PubMed
    1. Benedeczky I, Molnár E, Somogyi P. The cisternal organelle as a Ca2+-storing compartment associated with GABAergic synapses in the axon initial segment of hippocampal pyramidal neurones. Exp Brain Res. 1994;101:216–230. - PubMed
    1. Black JA, Kocsis JD, Waxman SG. Ion channel organization of the myelinated fiber. Trends Neurosci. 1990;13:48–54. - PubMed

Publication types

LinkOut - more resources