. 1996 Oct 1;16(19):6183-96.
doi: 10.1523/JNEUROSCI.16-19-06183.1996.

The leaving or Q fraction of the murine cerebral proliferative epithelium: a general model of neocortical neuronogenesis

Collaborators, Affiliations

The leaving or Q fraction of the murine cerebral proliferative epithelium: a general model of neocortical neuronogenesis

T Takahashi et al. J Neurosci. .

Abstract

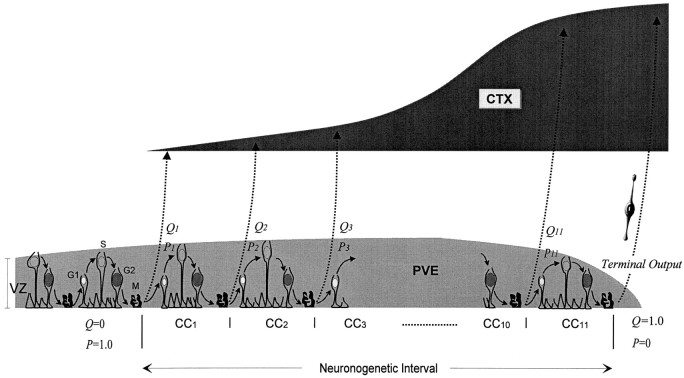
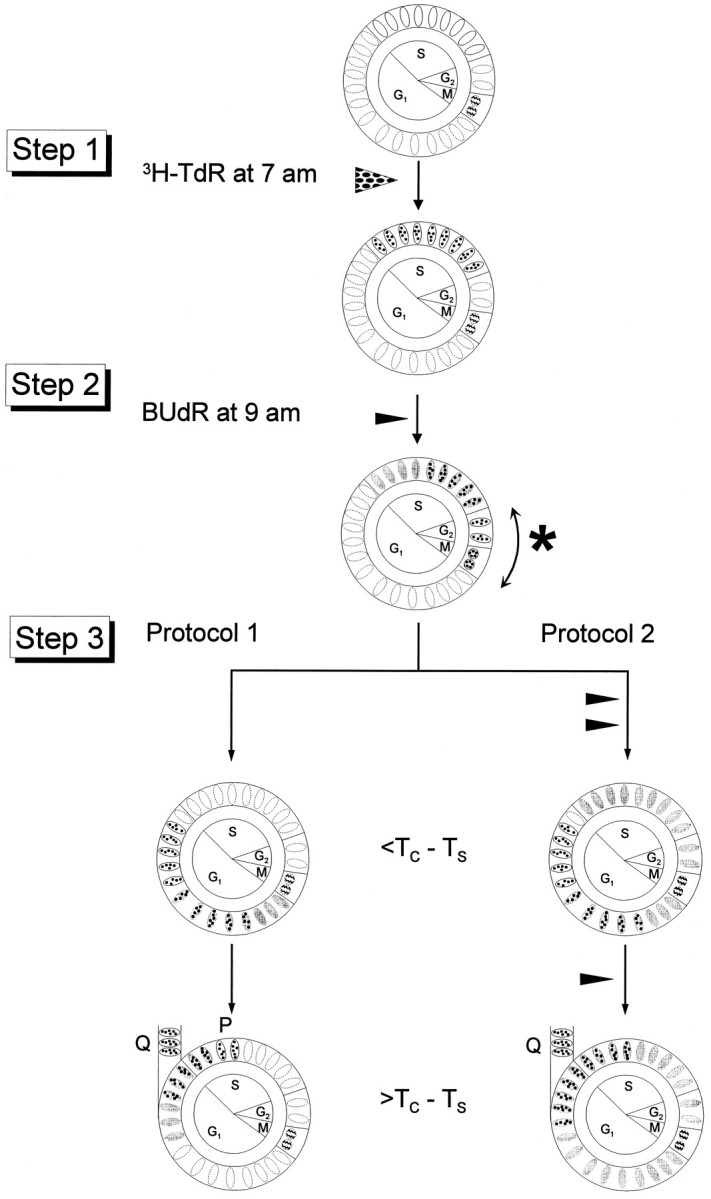
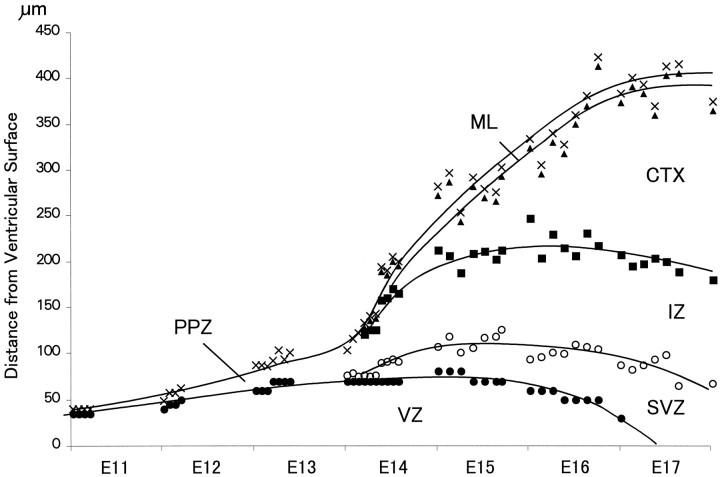
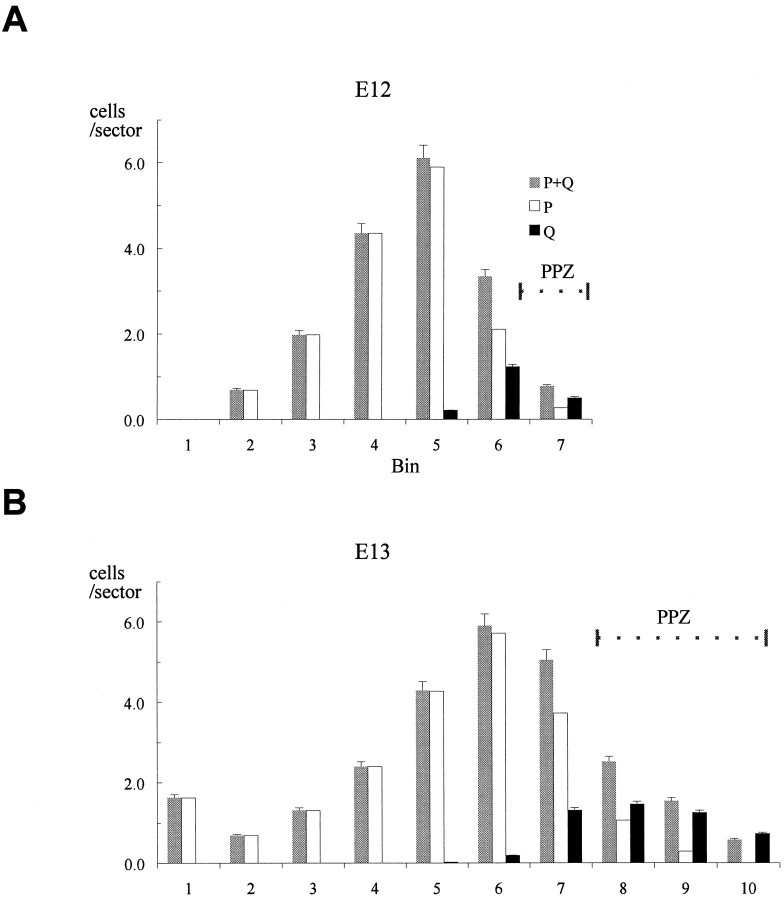
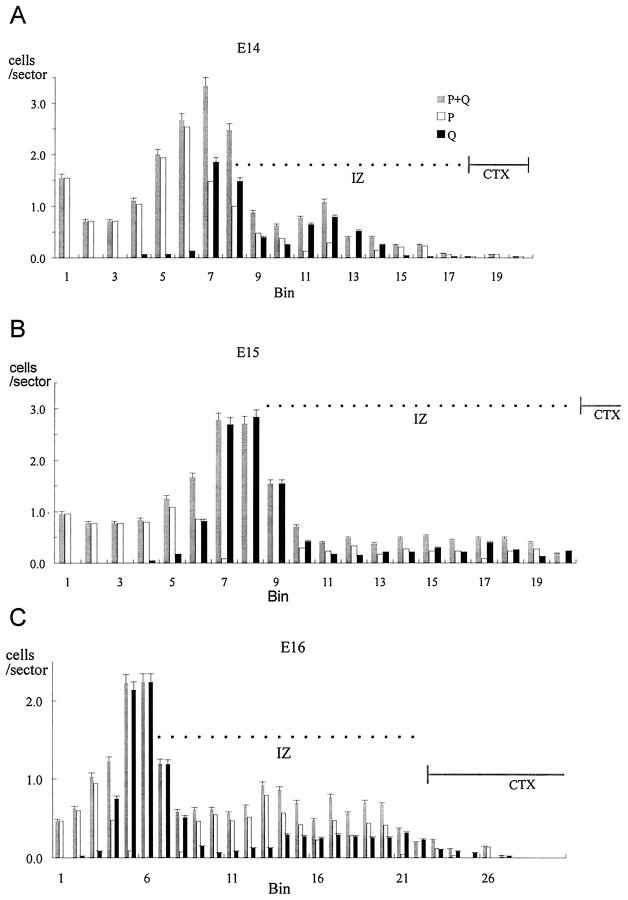
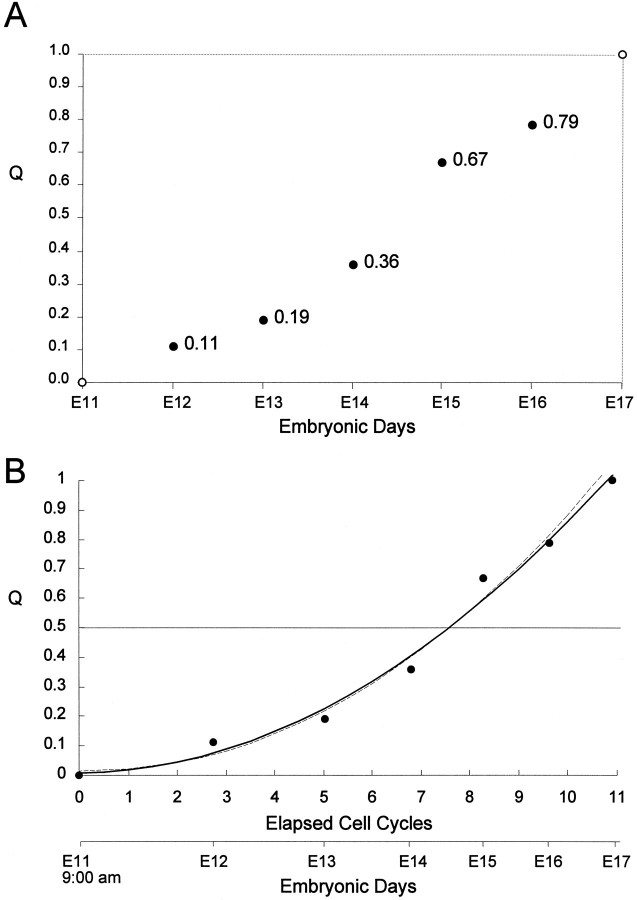
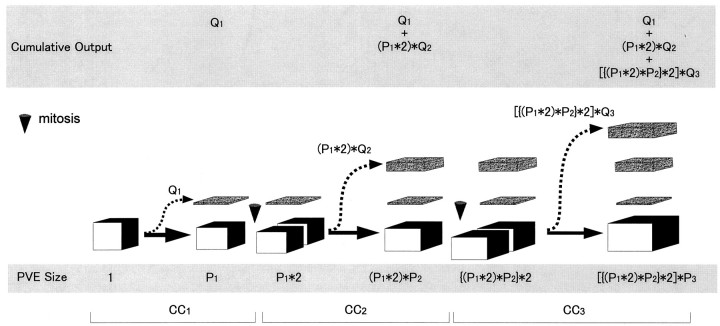
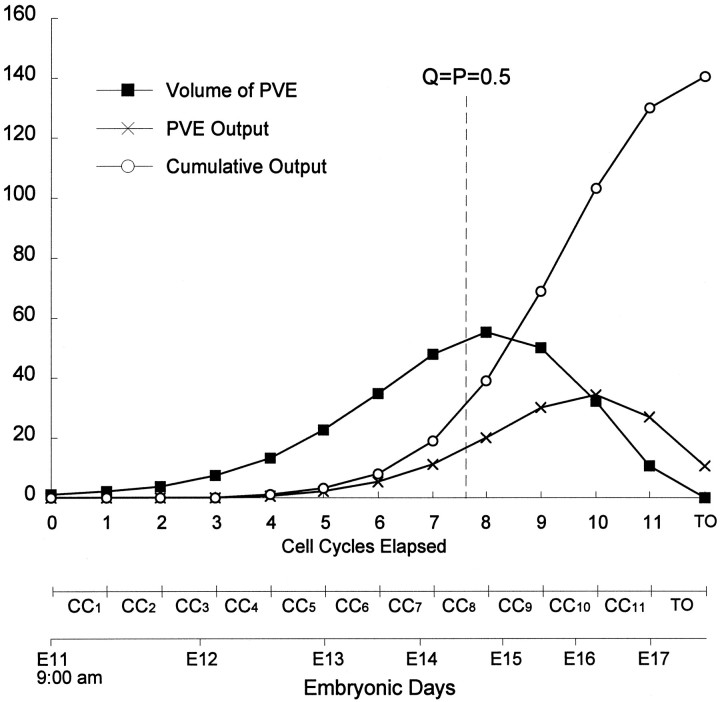
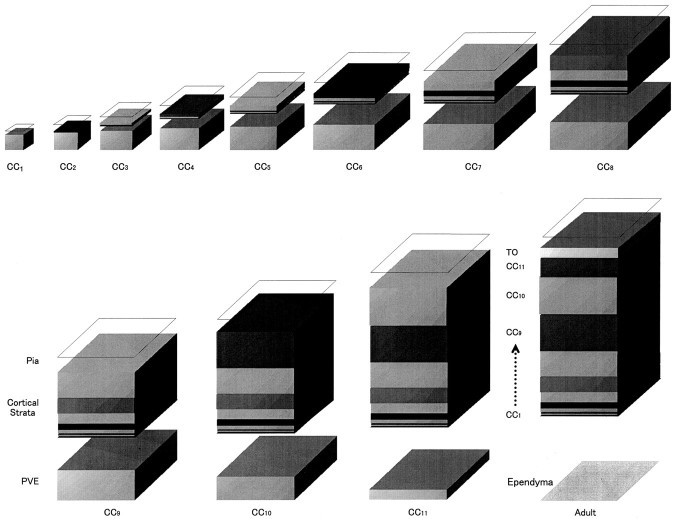
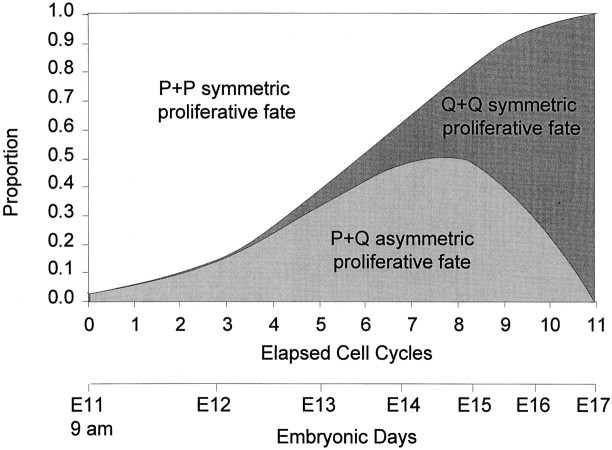
Neurons of neocortical layers II-VI in the dorsomedial cortex of the mouse arise in the pseudostratified ventricular epithelium (PVE) through 11 cell cycles over the six embryonic days 11-17 (E11-E17). The present experiments measure the proportion of daughter cells that leave the cycle (quiescent or Q fraction or Q) during a single cell cycle and the complementary proportion that continues to proliferate (proliferative or P fraction or P; P = 1 - Q). Q and P for the PVE become 0.5 in the course of the eighth cycle, occurring on E14, and Q rises to approximately 0.8 (and P falls to approximately 0.2) in the course of the 10th cycle occurring on E16. This indicates that early in neuronogenesis, neurons are produced relatively slowly and the PVE expands rapidly but that the reverse happens in the final phase of neuronogenesis. The present analysis completes a cycle of analyses that have determined the four fundamental parameters of cell proliferation: growth fraction, lengths of cell cycle, and phases Q and P. These parameters are the basis of a coherent neuronogenetic model that characterizes patterns of growth of the PVE and mathematically relates the size of the initial proliferative population to the neuronal population of the adult neocortex.


Figures

Fig. 1.
Fig. 1.
Schematic representation of the developmental changes associated with the PVE in the neocortical cerebral wall during the neuronogenetic interval. The PVE is approximately coextensive with the ventricular zone (VZ) lying at the ventricular margin. Young postmitotic neurons migrate across the intervening cerebral wall (broken arrows) to the developing cortex (CTX). The cells of the PVE undergo interkinetic nuclear migration (curved arrows) in the course of the cell cycle, which begins with the G1 phase and progresses through S and G2 and is completed with the M phase. Postmitotic cells either exit the cell cycle (Q fraction,Q1–Q11) or elongate throughG1 phase to reenter S phase (P fraction,P1–P11). Before the onset of neuronogenesis, the P fraction is 1.0, and theQ fraction is 0. Q becomes >0 with the onset of neuronogenesis (i.e., Q1 > 0) and eventually reaches 1.0 at the end of the neuronogenetic interval, which corresponds to 11 integer cell cycles (CC1–CC11) in mouse. Reciprocally,P follows a path from 1.0 to 0. The PVE gradually increases in height, but over the final cycles it involutes and ceases to exist with the termination of CC11. At the completion of CC11, all postmitotic cells exit the VZ asQ (Terminal Output).
Fig. 2.
Fig. 2.
Labeling protocols for determining the number of cells in the combined Q+P fractions (Protocol 1) and those in the Q fraction (Protocol 2). Step 1, The embryos are exposed to tritiated thymidine (3H-TdR) at 7:00 A.M. on each of E12–E16. The3H-TdR labels the cells in S, as indicated by the dots over the nuclei. Step 2, 2 hr later at 9:00 A.M. the embryo is exposed to BUdR, which again labels cells in S phase (gray-filled nuclei). The sequence of 3H-TdR and BUdR exposures results in three types of labeled cells: (1) cells that leftS for G2 during the 2 hr interinjection interval, referred to as the 2 hr cohort of cells (∗), will be labeled only with 3H-TdR (dots in the nucleus); (2) cells that entered S during the 2 hr interinjection interval will be labeled only with BUdR (gray-filled nuclei); and (3) cells that remained in S during the interinjection interval (gray-filled nuclei and black dots). Embryos labeled in this way are then partitioned into two subsets (Step 3). Step 3, Protocol 1(left), Embryos receive no further exposure to BUdR. At an interval after the initial BUdR exposure, which is longer than the duration of the cell cycle minus the duration of S phase (>TCTS), both the Q and P fraction cells of the 2 hr cohort will be labeled only with3H-TdR. That is, the number of cells labeled only with3H-TdR with Protocol 1 corresponds to the number of cells of the cohort in the combined Q and P fractions (NQ+P). Step 3, Protocol 2(right), Embryos will receive a sequence of additional exposures to BUdR (Step 3, right). At an interval >TCTS, the P fraction cells of the 2 hr cohort will reenter S phase and become labeled with BUdR, and thus are eliminated from the cohort. That is, the number of cells labeled only with 3H-TdR withProtocol 2 corresponds to the number of cells of the cohort in the Q fraction (NQ) .
Fig. 3.
Fig. 3.
Growth of strata of the murine dorsomedial cerebral wall during the neuronogenetic interval E11–E17 (modified from Takahashi et al., 1995a). The height of each stratum was obtained by direct measurement in histological sections. The ventricular surface is at 0 on the y-axis. The upper border of the ventricular zone (VZ) is indicated byclosed circles, the pial surface by X, the subventricular zone and intermediate zone (SVZ, IZ) border by open circles, the border betweenIZ and the developing cortex (CTX) by closed squares, and the border betweenCTX and the molecular layer (ML) byclosed triangles. The contours tracing progressive growth of strata were made initially by a least-squares fit to a fourth-order curve and then smoothed by eye. Through early E14, the cerebral wall has only two strata, the primitive plexiform zone (PPZ) and the VZ. The VZ approaches maximum height by E15, which then declines ∼50% by the end of E16 as it involutes. The cortical strata (ML + CTX), by contrast, increase progressively in height. The period of most rapid growth of the IZ is completed early on E14.
Fig. 4.
Fig. 4.
A, C, Representative micrographs of preparations labeled according to Protocol 1 in Figure2; B, D, those labeled according to Protocol 2 in Figure2. These micrographs show comparative distributions of cells of the combined Q + P (A, C) and Q fractions (B, D) in the 2 hr cohort at E12 (A, B) and E15 (C, D). At E12, the micrograph includes the full height of the cerebral wall. The pial surface is indicated by a dashed line, and the border between the VZ and SVZ zones is indicated by asterisks. At E15, the micrograph includes only the VZ and the adjacent SVZ and IZ. Cells marked only by 3H-TdR are recognized as accumulations of silver grains over the cell nucleus (arrowheads). Cells labeled with BUdR or BUdR and3H-TdR have darkly stained nuclei. Scale bar (shown inA): 20 μm.
Fig. 5.
Fig. 5.
The distributions of cells of the P, Q, and P+Q fractions on E12 and E13. The analysis is undertaken in a coronal sector of the dorsomedial cerebral wall that is 100 μm in its medial–lateral dimension and 4 μm (corresponding to section thickness) in its rostral–caudal dimension. The sector is divided in its radial dimension into bins (x-axis) 10 μm in height and numbered 1, 2, 3, and so on from the ventricular margin (Takahashi et al., 1992, 1993). The number of cells in the Q (NQ) and P+Q fractions (NP+Q) for each bin (y-axis) are determined according to the method illustrated and described in Figure 2. The values for P fraction cells (NP) are estimated asNP+Q − NQ. On E12 and E13, the dorsomedial cerebral wall is formed of only two strata, the VZ and the PPZ (see Fig. 3). Error bars represent SEM.
Fig. 6.
Fig. 6.
The distributions of cells of the P, Q, and P+Q fractions on E14–E16. See legend to Figure 5 for details. On E14–E16, the dorsomedial cerebral wall is formed of the VZ, the IZ, and the developing cortex (CTX; see Fig. 3). The bins 10 μm in height (see legend to Fig. 5) are the x-axis. Error bars represent SEM.
Fig. 7.
Fig. 7.
The progression of Q during the neuronogenetic interval of the dorsomedial cerebral PVE. A, Experimentally determined values for Q for E12–E16 are positioned bysolid circles. Open circles at 0 on E11 and at 1.0 on E17 mark the approximate time of initiation and termination of the neuronogenetic interval as estimated from autoradiographic cell birth date experiments (Caviness, 1982).B, The curvilinear ascending progression of Q is plotted with respect to both E11 and E17 and the elapsed integer cell cycles that comprise the neuronogenetic interval. Two fits are shown inB, both incorporating the experimentally determined values of Q plotted for E12–E16 in A (i.e., thesolid circles in A). For the solid line plot, a least-squares curvilinear fit was made to the experimentally determined data plus the initial 0 and terminal 1.0 values of Q for E11 and E17, respectively. For the dashed line plot, a least-squares curvilinear fit was made to the experimentally determined data without considering the initial 0.0 and terminal 1.0 values of Q. Note that the two fits are essentially identical, indicating that the estimates of Q = 0 and Q = 1.0 at E11 and E17, respectively, must be quite close to the actual values.
Fig. 8.
Fig. 8.
Growth of cortical strata and PVE occurring in the course of the first three integer cell cycles. Growth of the cortical strata reflects the fate and contributions of the Q fraction (broken arrows), whereas the expansion and growth of the PVE reflects the fate of the P fraction (thick arrows). For this illustration, a “unit” population of PVE at the beginning of the first cell cycle (CC1, founder population) is shown as a cube with a volume of 1. The events occurring during each cell cycle are enclosed inbrackets. At the conclusion ofCC1, the postmitotic population is partitioned according to its Q and P fates. Cells with Q fate exit the VZ and migrate to the cortex (dashed arrows). Cells of P fate remain in the PVE (thick arrow), now corresponding to a volume of P1, and will form the proliferative population for CC2. DuringCC2, the premitotic population (size now = P1) will double in size (=P1∗2, shown as two separate blocks). Again, a proportion of cells equal to Q2for CC2 exit the VZ so that the exiting population will be (P1∗2)∗Q2, i.e., the volume of the PVE at the beginning of CC2 × Q for CC2. As the population exits, the size of the population that will progress to CC3 will be(P1∗2)∗P2, where P2is P for CC2. The cumulative output from CC1and CC2 will be the sum of the output of the two cycles, that is, Q1 + (P1∗2)∗Q2. The same process repeats itself during the third cell cycle (CC3): the size of the population that will progress to CC4will be[{(P1∗2)∗P2}∗2]∗P3and the cumulative output will be Q1 + (P1∗2)∗Q2 + [{(P1∗2)∗P2}∗2]∗Q3. Note that this is a highly schematic representation that describes the behavior of a unit of PVE in which proliferative activity is perfectly synchronized.
Fig. 9.
Fig. 9.
Expansion and involution of a founder PVE population and cell output over the course of the neuronogenetic interval. The volume of the PVE (Volume of PVE), the cell output from a single cell cycle (PVE Output), and the cumulative cell output (Cumulative Output) are calculated from Equations 1 and 2 in the Discussion. The values are plotted with respect to both the elapsed cell cycles,CC1–CC11, and embryonic days on the abscissa. At the beginning of the neuronogenetic interval, where 0 cell cycles have elapsed (i.e., the beginning of CC1) at 9:00 A.M. on E11, the PVE volume is set at the arbitrary unit value of 1.0, and cell output at this point is by definition 0. The vertical dashed linedivides the neuronogenetic interval with respect to where Q and P reach the critical turning point of 0.5. To the left of thevertical dashed line, Q < 0.5 and the PVE is expanding; to the right of the vertical dashed line, Q > 0.5 and the PVE is involuting. The PVE size reaches its maximum value at this point, and cell output/cycle is maximum beyond this point. The P fraction cells ofCC11 will divide to produce two daughter cells, all of which (Q = 1.0) will exit the cell cycle as the terminal output (TO on the abscissa). The contribution of Q from the first half of the 11 cell cycles (CC1–6) is only ∼6%, whereas that of the last two cycles (CC10–11) and the terminal output is ∼50% of the total neuronal population of the cortex at the end of the neuronogenetic interval. Our previous estimate of the cumulative output throughout the full neuronogenetic interval (Caviness et al., 1995) was approximately twice that represented here. This is because the unit founder population was considered to be the population of the cell cycle preceding CC1 for the previous estimate but was considered to be the population at the beginning of G1 ofCC1 in this plot.
Fig. 10.
Fig. 10.
Graphic representation of the entire set of dynamic events of the PVE. This schema shows the growth and involution of the PVE and the output of the PVE at each of the 11 cell cycles comprising the neuronogenetic interval. The fractional contribution of the PVE output to the postmigratory neuronal population of the cortical plate is also shown. The PVE continues to enlarge as long as p > 0.5, that is, throughCC8. Thereafter, in the course ofCC9–11, the PVE becomes progressively smaller and eventually is replaced by the ependyma, which will line the ventricle in the adult animal. The contribution of Q to theCortical Strata is minimal initially but increases with successive integer cycles and is maximum withCC10. The relative contribution of the final cycle, CC11, and the terminal output (TO) to the neuronal population of the cortex lessens with exhaustion of the PVE. Note that the schema ignores the consequences of cell death on the final proportions of neurons to arise from the successive integer cycles.
Fig. 11.
Fig. 11.
P and Q in relation to proliferative fate. Theupper bar of the double abscissa marks the elapsed integer cell cycles CC1–11 of the dorsomedial murine cerebral PVE; the lower bar of the abscissa marks the elapse of time in Embryonic Days. The ordinate provides a calculation, on the basis of the data shown in Figure 7 and the binomial theorem, for the proportion of total mitotic divisions at each integer cycle that will give rise only to P cells (P+P symmetric proliferative fate), only to Q cells (Q+Q symmetric proliferative fate), or to P + Q cells (P+Q asymmetric proliferative fate). For example, if Q = 0.3 and P = 0.7, there will be Q2 = (0.3)2 = 0.09 and P2 = (0.7)2 = 0.49 symmetric divisions and 2 × P × Q = 2 × 0.3 × 0.7 = 0.42 asymmetric divisions. All three types of mitoses could exist at all times, but the sum of their proportions will be equal to 1.0. Early in the neuronogenetic period, the P+P symmetric cell divisions should predominate. Late in the neuronogenetic interval, the Q+Q symmetric cell divisions should predominate. The proportion of asymmetric cell divisions should reach its maximum when P = Q = 0.5, i.e., at approximately CC8, at which time the proportion of Q+Q- and P+P-type symmetric cell divisions should be equal.
Fig. 12.
Fig. 12.
Lineage continuity. A, TheProbability of Extinction of a hypothetical monoclonal lineage derived from a single PVE founder cell (open circles) is plotted through CC11 of the neuronogenetic interval. The founder cell is presumed to be at the beginning of G1 at the beginning of CC1. The probability that such a lineage will become extinct by CC11 is 0.04 (arrow with dashed line), which means that it has a 96% chance of continuing to exist over the entire neuronogenetic interval and thus to contribute to each of cortical layers VI through II. The cumulative probabilities of extinction of hypothetical polyclonal lineages of two, three, or seven cells barely rise above 0 by CC11. Thus, such polyclonal lineages would have virtually a 100% chance of sustaining histogenesis of cortical layers VI–II. B, The cumulative probabilities of extinction of hypothetical monoclonal lineages arising from single founder cells present at the beginning of G1 at the beginning of each of the integer cell cycles of the neuronogenetic interval. The probability of lineage extinction mounts rapidly with initiation at each successive integer cycle. The lowest probability of extinction is associated with a monoclonal lineage initiated atCC1 (open circle plot inA), but a lineage initiated atCC4 will have a cumulative probability of extinction of ∼0.57 through CC11(arrowhead). These extinction probabilities become quite high even before the final three cell cycles of the neuronogenetic interval, after which a substantial proportion of the neurons of the cortex are still to be produced (Figs. 9, 10). Thedarker lines represent lineages of the sort initiated in retroviral studies (for details, see the text).

Similar articles

Cited by

References

    1. Austin CP, Cepko CL. Cellular migration patterns in the developing mouse cerebral cortex. Development. 1990;110:713–732. - PubMed
    1. Bayer SA, Altman J. Raven; New York: 1991. Neocortical development. .
    1. Blaschke A, Staley K, Chun J. Widespread programmed cell death in proliferative and postmitotic regions of the fetal cerebral cortex. Development. 1996;122:1165–1174. - PubMed
    1. Caviness VS., Jr Neocortical histogenesis in normal and reeler mice: a developmental study based upon [3H]thymidine autoradiography. Dev Brain Res. 1982;4:293–302. - PubMed
    1. Caviness VS, Jr, Takahashi T, Nowakowski RS. Numbers, time and neocortical neuronogeneis: a general developmental and evolutionary model. Trends Neurosci. 1995;18:379–383. - PubMed

Publication types

LinkOut - more resources