

Activation of the phosphosignaling protein CheY. I. Analysis of the phosphorylated conformation by 19F NMR and protein engineering
- PMID: 8514749
- PMCID: PMC2899703
Activation of the phosphosignaling protein CheY. I. Analysis of the phosphorylated conformation by 19F NMR and protein engineering
Abstract
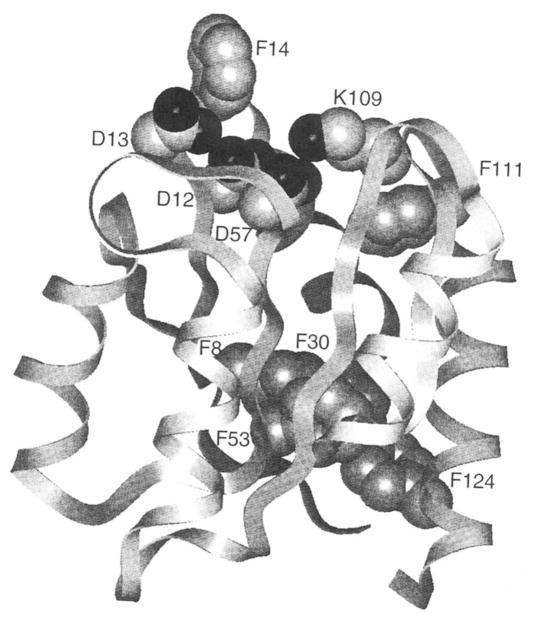
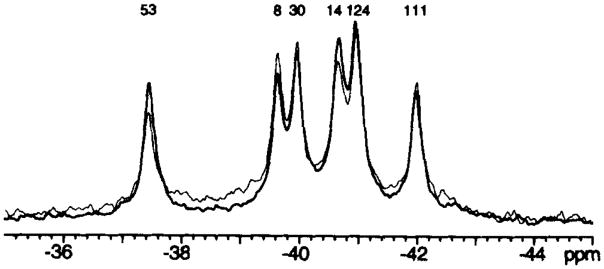
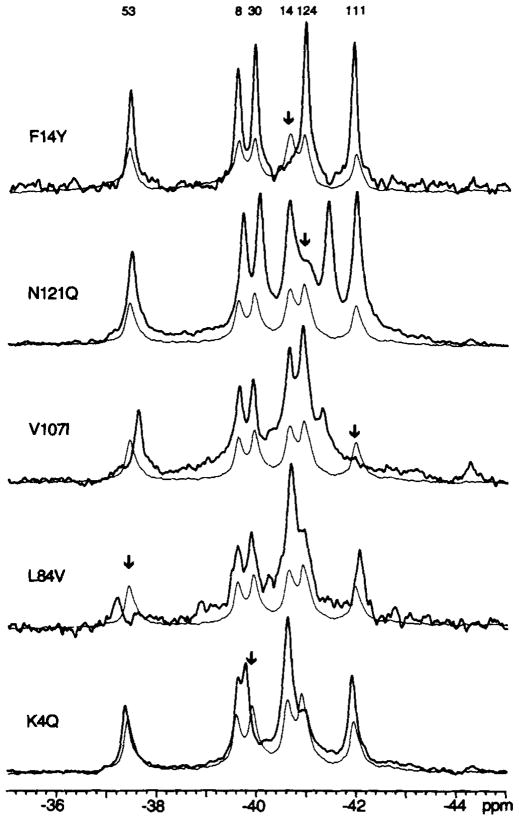
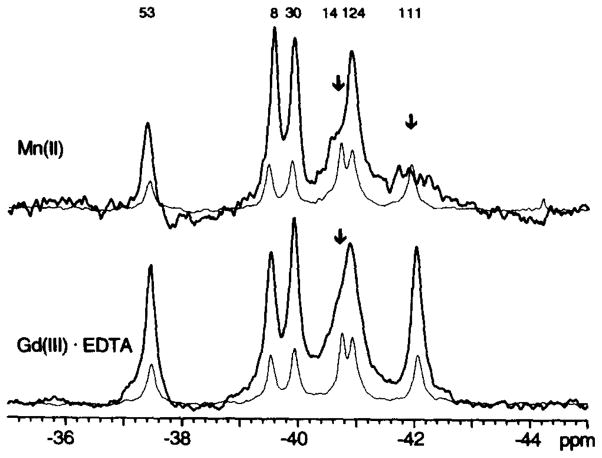
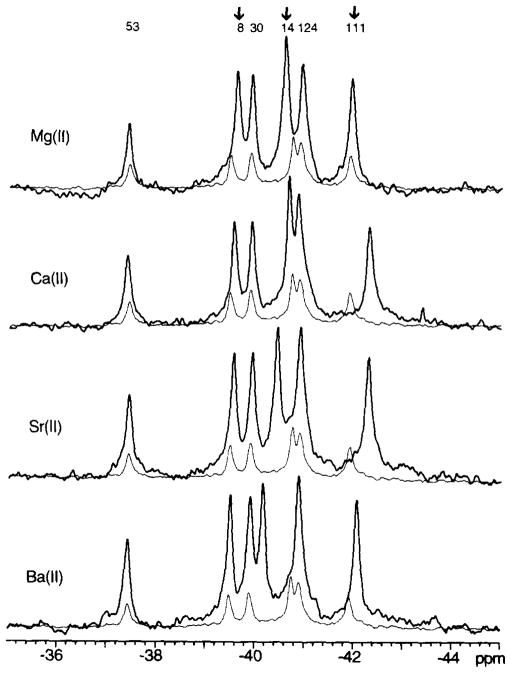
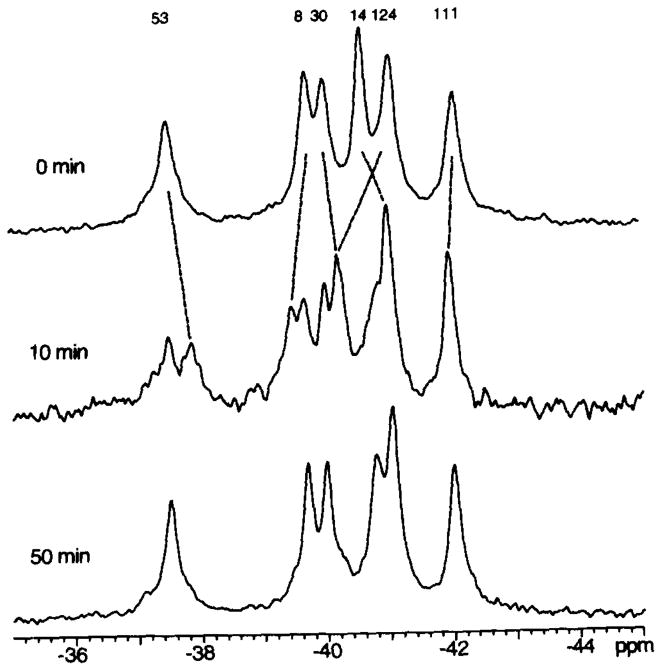
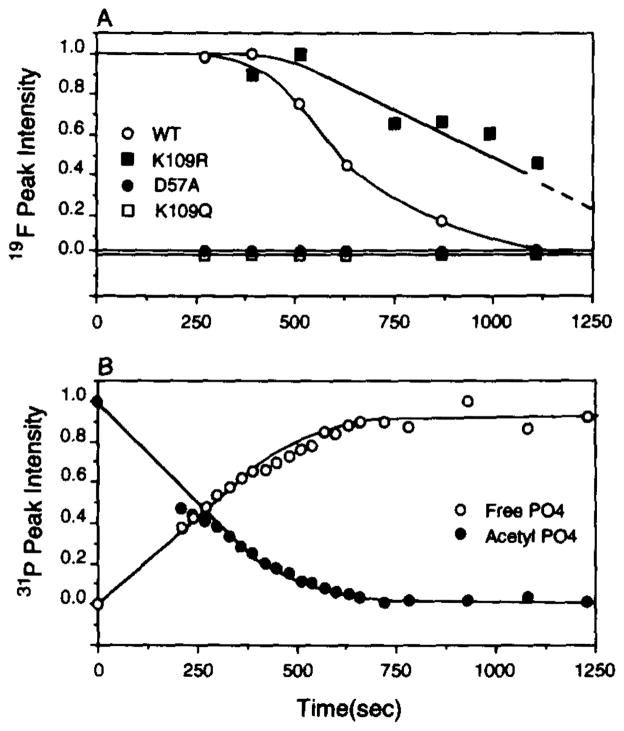
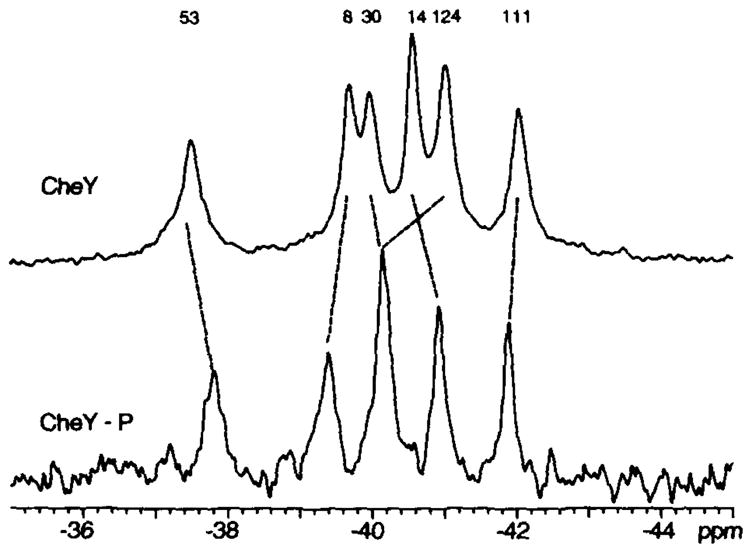
CheY, the 14-kDa response regulator protein of the Escherichia coli chemotaxis pathway, is activated by phosphorylation of Asp57. In order to probe the structural changes associated with activation, an approach which combines 19F NMR, protein engineering, and the known crystal structure of one conformer has been utilized. This first of two papers examines the effects of Mg(II) binding and phosphorylation on the conformation of CheY. The molecule was selectively labeled at its six phenylalanine positions by incorporation of 4-fluorophenylalanine, which yielded no significant effect on activity. One of these 19F probe positions monitored the vicinity of Lys109, which forms a salt bridge to Asp57 in the apoprotein and has been proposed to act as a structural "switch" in activation. 19F NMR chemical shift studies of the labeled protein revealed that the binding of the cofactor Mg(II) triggered local structural changes in the activation site, but did not perturb the probe of the Lys109 region. The structural changes associated with phosphorylation were then examined, utilizing acetyl phosphate to chemically generate phsopho-CheY during NMR acquisition. Phosphorylation triggered a long-range conformational change extending from the activation site to a cluster of 4 phenylalanine residues at the other end of the molecule. However, phosphorylation did not perturb the probe of Lys109. The observed phosphorylated conformer is proposed to be the first step in the activation of CheY; later steps appear to perturb Lys109, as evidenced in the following paper. Together these results may give insight into the activation of other prokaryotic response regulators.
Figures
Similar articles
-
Activation of the phosphosignaling protein CheY. II. Analysis of activated mutants by 19F NMR and protein engineering.J Biol Chem. 1993 Jun 25;268(18):13089-96. J Biol Chem. 1993. PMID: 8514750 Free PMC article.
-
Roles of the highly conserved aspartate and lysine residues in the response regulator of bacterial chemotaxis.J Biol Chem. 1991 May 5;266(13):8348-54. J Biol Chem. 1991. PMID: 1902474
-
Effects of phosphorylation, Mg2+, and conformation of the chemotaxis protein CheY on its binding to the flagellar switch protein FliM.Biochemistry. 1994 Aug 30;33(34):10470-6. doi: 10.1021/bi00200a031. Biochemistry. 1994. PMID: 8068685
-
Response regulation in bacterial chemotaxis.J Cell Biochem. 1993 Jan;51(1):41-6. doi: 10.1002/jcb.240510109. J Cell Biochem. 1993. PMID: 8381790 Review.
-
Use of 19F NMR to probe protein structure and conformational changes.Annu Rev Biophys Biomol Struct. 1996;25:163-95. doi: 10.1146/annurev.bb.25.060196.001115. Annu Rev Biophys Biomol Struct. 1996. PMID: 8800468 Free PMC article. Review.
Cited by
-
Mapping allosteric communications within individual proteins.Nat Commun. 2020 Jul 31;11(1):3862. doi: 10.1038/s41467-020-17618-2. Nat Commun. 2020. PMID: 32737291 Free PMC article.
-
Cytokinin regulates type-A Arabidopsis Response Regulator activity and protein stability via two-component phosphorelay.Plant Cell. 2007 Dec;19(12):3901-14. doi: 10.1105/tpc.107.052662. Epub 2007 Dec 7. Plant Cell. 2007. PMID: 18065689 Free PMC article.
-
Two binding modes reveal flexibility in kinase/response regulator interactions in the bacterial chemotaxis pathway.Proc Natl Acad Sci U S A. 1998 Jun 23;95(13):7333-8. doi: 10.1073/pnas.95.13.7333. Proc Natl Acad Sci U S A. 1998. PMID: 9636149 Free PMC article.
-
Structural studies of Bcl-xL/ligand complexes using 19F NMR.J Biomol NMR. 2006 Apr;34(4):221-7. doi: 10.1007/s10858-006-0005-y. J Biomol NMR. 2006. PMID: 16645812
-
The acetate switch.Microbiol Mol Biol Rev. 2005 Mar;69(1):12-50. doi: 10.1128/MMBR.69.1.12-50.2005. Microbiol Mol Biol Rev. 2005. PMID: 15755952 Free PMC article. Review.
References
-
- Bourret RB, Borkovich KA, Simon MI. Annu Rev Biochem. 1991;60:401–441. - PubMed
-
- Stock JB, Surette MG, McCleary WR, Stock AM. J Biol Chem. 1992;267:19753–19756. - PubMed
-
- Parkinson JS, Kofoid EC. Annu Rev Genetics. 1992;26:71–112. - PubMed
-
- Stock JB, Stock AM, Mottonen JM. Nature. 1990;344:395–400. - PubMed
-
- Borkovich KA, Simon MI. Cell. 1990;63:1339–1348. - PubMed
Publication types
MeSH terms
Substances
Grants and funding
LinkOut - more resources
Full Text Sources
Other Literature Sources
Molecular Biology Databases
Research Materials
