[Preprint]. 2024 Oct 23:2024.10.23.619886.
doi: 10.1101/2024.10.23.619886.

Recent Endemic Coronavirus Infection Associates With Higher SARS-CoV-2 Cross-Reactive Fc Receptor Binding Antibodies

Affiliations

Recent Endemic Coronavirus Infection Associates With Higher SARS-CoV-2 Cross-Reactive Fc Receptor Binding Antibodies

David J Bean et al. bioRxiv. .

Abstract

Recent documented infection with an endemic coronavirus (eCoV) associates with less severe coronavirus disease 2019 (COVID-19), yet the immune mechanism behind this protection has not been fully explored. We measured both antibody and T cell responses against severe acute respiratory syndrome coronavirus 2 (SARS-CoV-2) in SARS-CoV-2 naïve individuals classified into two groups, either with or without presumed recent eCoV infections. There was no difference in neutralizing antibodies and T cell responses against SARS-CoV-2 antigens between the two groups. SARS-CoV-2 naïve individuals with recent presumed eCoV infection, however, had higher levels of Fc receptor (FcR) binding antibodies against eCoV spikes (S) and SARS-CoV-2 S2. There was also a significant correlation between eCoV and SARS-CoV-2 FcR binding antibodies. Recent eCoV infection boosts cross-reactive antibodies that can mediate Fc effector functions, and this may play a role in the observed heterotypic immune protection against severe COVID-19.


Conflict of interest statement

The authors have declared that no conflict of interest exists.

Figures

Figure 1.
Figure 1.. Classification of presumed SARS-CoV-2 infections based on antibody levels.
(A) IgG antibody levels against SARS-CoV-2 RBD and nucleocapsid protein were measured in individuals with a previous SARS-CoV-2 infection (black), previous COVID-19 vaccination with no documented history of SARS-CoV-2 infections (pink), no known SARS-CoV-2 infection or COVID-19 vaccination (green), or pre-pandemic samples collected before March 2020 (purple). The dotted lines specify cutoffs that were established to classify individuals with presumed undiagnosed SARS-CoV-2 infection. (B) The accuracy and other test characteristics of the classification based on the established cutoffs for classifying individuals into the specified groups. The values in parentheses display the 95% CI.
Figure 2.
Figure 2.. Humoral immune responses to SARS-CoV-2 spike antigens.
Plasma antibody responses in those with documented SARS-CoV-2 spike exposure (previous SARS-CoV-2 infection (black circle) or prior COVID-19 vaccination (black square)), presumed or documented recent eCoV infection (gray circle), or without a presumed recent eCoV infection (white circle). (A and B) IgG antibody levels against SARS-CoV-2 RBD (A) or SARS-CoV-2 spike S2 subunit (B). (C) Neutralization responses against a VSV-ΔG pseudovirus expressing the SARS-CoV-2-Wuhan spike protein. (D-G) Titer of SARS-CoV-2 RBD (D) or SARS-CoV-2 S2 (F) specific antibodies binding to the Fc receptor, FcγRIIIa, or the ratio of those FcR binding antibodies to the SARS-CoV-2 RBD (E) or SARS-CoV-2 S2 (G) IgG levels in panel (A and B). The dark horizontal lines in each scatter dot plot denote the median and interquartile range. Statistical analyses were performed using either Kruskal-Wallis test with Dunn multiple comparison test or Mann-Whitney U test. P-values less than 0.1 are displayed. *, **, ***, and **** represent p-values <0.05, <0.01, <0.001, and <0.0001, respectively.
Figure 3.
Figure 3.. Higher alpha eCoV nucleocapsid antibody responses predicts positive responses in the SARS-CoV-2 S2 specific antibody FcR binding assay.
(A) Individuals were separated into two groups based on positive (responders) or absent (non-responders) FcγRIIIa SARS-CoV-2 S2 specific antibody binding. This responder and non-responder classification was used in a multivariate logistic regression model. This data is the same as Fig. 2F. (B) The odds ratio of variables used in the multivariate logistic regression model to predict positive SARS-CoV-2 S2 antibody FcR binding responses. The error bars represent the 95% CI.
Figure 4.
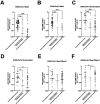
Figure 4.. ECoV specific antibody FcR binding responses correlate with SARS-CoV-2 S2 antibody responses.
Plasma antibody responses were measured in individuals with either a previous SARS-CoV-2 spike exposure (previous SARS-CoV-2 infection (black circle) and previous COVID-19 vaccination (black square)), presumed or documented recent eCoV infection (gray circle), or without a presumed recent eCoV infection (white circle). (A and B) IgG antibody responses against HCoV-229E (A) or HCoV-OC43 (B) spikes. (C and D) Level of HCoV-229E (C) or HCoV-OC43 (D) spike-specific antibodies binding to the Fc receptor, FcγRIIIa. (E and F) Ratio of Fc receptor antibody binding (C and D) to antigen specific IgG (A and B) in HCoV-229E (E) or HCoV-OC43 (F) spike-specific antibody responses. (G and H) Correlations between HCoV-229E (E) or HCoV-OC43 (F) spike-specific antibody FcR binding to SARS-CoV-2 S2 specific antibody FcR binding responses. Black dots and lines represent individuals with presumed or documented recent eCoV infection, while gray represents those without a presumed recent eCoV infection. The lines show a simple linear regression with the 95% CI. The dark horizontal lines in each scatter dot plot denote the median and interquartile range. Statistical analyses were performed using either Kruskal-Wallis test with Dunn multiple comparison test or Mann-Whitney U test. P-values less than 0.1 are displayed. * represents p-values <0.05.
Figure 5.
Figure 5.. T cell responses against SARS-CoV-2 antigens are similar between individuals with or without presumed recent eCoV infections.
T cell responses were measured in individuals with either a previous SARS-CoV-2 spike exposure (previous SARS-CoV-2 infection (black circle) and previous COVID-19 vaccination (black square)), presumed or documented recent eCoV infection (gray circle), or without a presumed recent eCoV infection (white circle). Cells were stimulated with SARS-CoV-2 peptide pools and percent of activated (CD134+ CD137+) CD4+ T cells and (CD69+ CD137+) CD8+ T cells were measured. (A-B) CD4+ (A) and CD8+ (B) T cell activation was measured after stimulation with SARS-CoV-2 spike peptides. (C-D) CD4+ (C) and CD8+ (D) T cell activation was measured after stimulation with SARS-CoV-2 nucleocapsid peptides. (E-F) CD4+ (E) and CD8+ (F) T cell activation was measured after stimulation with SARS-CoV-2 nsp12/nsp13 peptides. Data were background subtracted against the negative control (DMSO only). The dark horizontal lines in each scatter dot plot denote the median and interquartile range. Note, the y axis varies among the different panels. Statistical analyses were performed using either Kruskal-Wallis test with Dunn multiple comparison test or Mann-Whitney U test. P-values less than 0.1 are displayed. *, **, ***, and **** represent p-values <0.05, <0.01, <0.001, and <0.0001, respectively.

Similar articles

References

    1. Hamre D, Beem M. 1972. Virologic studies of acute respiratory disease in young adults. V. Coronavirus 229E infections during six years of surveillance. Am J Epidemiol 96:94–106. - PMC - PubMed
    1. Edridge AWD, Kaczorowska J, Hoste ACR, Bakker M, Klein M, Loens K, Jebbink MF, Matser A, Kinsella CM, Rueda P, Ieven M, Goossens H, Prins M, Sastre P, Deijs M, van der Hoek L. 2020. Seasonal coronavirus protective immunity is short-lasting. Nat Med 26:1691–1693. - PubMed
    1. Dangi T, Palacio N, Sanchez S, Park M, Class J, Visvabharathy L, Ciucci T, Koralnik IJ, Richner JM, Penaloza-MacMaster P. 2021. Cross-protective immunity following coronavirus vaccination and coronavirus infection. J Clin Invest 131:e151969. - PMC - PubMed
    1. Bean DJ, Monroe J, Liang YM, Borberg E, Senussi Y, Swank Z, Chalise S, Walt D, Weinberg J, Sagar M. 2024. Heterotypic immunity from prior SARS-CoV-2 infection but not COVID-19 vaccination associates with lower endemic coronavirus incidence. Sci Transl Med 16:eado7588. - PubMed
    1. Sagar M, Reifler K, Rossi M, Miller NS, Sinha P, White LF, Mizgerd JP. 2021. Recent endemic coronavirus infection is associated with less-severe COVID-19. J Clin Invest 131:e143380. - PMC - PubMed

Publication types

LinkOut - more resources