. 2024 Jul 16;121(29):e2400569121.
doi: 10.1073/pnas.2400569121. Epub 2024 Jul 10.

Stearoylation cycle regulates the cell surface distribution of the PCP protein Vangl2

Affiliations

Stearoylation cycle regulates the cell surface distribution of the PCP protein Vangl2

Jiafu Ying et al. Proc Natl Acad Sci U S A. .

Abstract

Defects in planar cell polarity (PCP) have been implicated in diverse human pathologies. Vangl2 is one of the core PCP components crucial for PCP signaling. Dysregulation of Vangl2 has been associated with severe neural tube defects and cancers. However, how Vangl2 protein is regulated at the posttranslational level has not been well understood. Using chemical reporters of fatty acylation and biochemical validation, here we present that Vangl2 subcellular localization is regulated by a reversible S-stearoylation cycle. The dynamic process is mainly regulated by acyltransferase ZDHHC9 and deacylase acyl-protein thioesterase 1 (APT1). The stearoylation-deficient mutant of Vangl2 shows decreased plasma membrane localization, resulting in disruption of PCP establishment during cell migration. Genetically or pharmacologically inhibiting ZDHHC9 phenocopies the effects of the stearoylation loss of Vangl2. In addition, loss of Vangl2 stearoylation enhances the activation of oncogenic Yes-associated protein 1 (YAP), serine-threonine kinase AKT, and extracellular signal-regulated protein kinase (ERK) signaling and promotes breast cancer cell growth and HRas G12V mutant (HRasV12)-induced oncogenic transformation. Our results reveal a regulation mechanism of Vangl2, and provide mechanistic insight into how fatty acid metabolism and protein fatty acylation regulate PCP signaling and tumorigenesis by core PCP protein lipidation.

Keywords: Vangl2; click chemistry; planar cell polarity; protein lipidation; stearoylation.


Conflict of interest statement

Competing interests statement:The authors declare no competing interest.

Figures
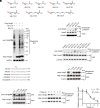
Fig. 1.
Fig. 1.
Vangl2 is stearoylated at an evolutionarily conserved cysteine residue. (A) Bioorthogonal chemical reporters for monitoring protein fatty acylation in this study. (B) Validation of Vangl2 fatty acylation by metabolic labeling with chemical reporters, hydroxylamine (NH2OH) treatment and streptavidin blot. (C) Confirmation of endogenous Vangl2 fatty acylation in HCC1806 cells by metabolic labeling and streptavidin bead pulldown. Relative fatty acylation level of Vangl2 is indicated. (D) Characterization of fatty acid selectivity on exogenous Flag-Vangl2 acylation by metabolic labeling and streptavidin bead pulldown. Relative fatty acylation level of Vangl2 is indicated. (E) ClustalW alignment of N-terminal domain sequences of Vangl2 proteins across different species, including human, mouse, Xenopus, zebrafish, and Drosophila. (F) Metabolic labeling followed by streptavidin bead pulldown and western blotting analysis showed that mutation of cysteine 103 to serine completely abolished Vangl2 stearoylation. Relative stearoylation level of Vangl2 is indicated. (G) Acyl-PEG exchange (APE) assay and mutagenesis analysis confirmed that Vangl2 stearoylation occurred on cysteine 103. Relative stearoylation level of Vangl2 is indicated. (H) Pulse–chase analysis showed dynamics of Vangl2 stearoylation. (I) Calculation of the half-life of Vangl2 stearoylation turnover from pulse–chase assays. All blots are representatives of at least three independent experiments. Data are represented as mean ± SEM, n = 3.
Fig. 2.
Fig. 2.
Stearoylation cycle of Vangl2 is regulated by ZDHHC9 and APT1. (A) Overexpression of HA-ZDHHC9 or ZDHHC11 substantially enhanced stearoylation level of Vangl2 in HEK293T cells. Relative stearoylation level of Vangl2 is indicated. (B) Co-IP assay showed the interactions between HA-ZDHHC3/9/11 and Flag-Vangl2 in HEK293T cells. Relative HA-ZDHHC3/9/11 level is indicated from the IP-Flag samples. (C) Co-IP assay showed the interactions between endogenous ZDHHC9 and Flag-Vangl2 in HCC1806 cells. Relative ZDHHC9 protein level is indicated from the IP-Flag samples. (D) The catalytic dead mutant of ZDHHC9 (C169S) failed to promote Vangl2 stearoylation in HEK293T cells. Relative stearoylation level of Vangl2 is indicated. (E) ZDHHC9 knockdown (KD) using shRNA substantially decreased Vangl2 stearoylation level in MCF10A cells. Relative stearoylation level of Vangl2 is indicated. (F) ZDHHC9 knockout (KO) using CRISPR-Cas9 substantially decreased Vangl2 stearoylation level in MCF10A cells. Relative stearoylation level of Vangl2 is indicated. (G) APE assay showed inhibition of Vangl2 stearoylation by the pan-ZDHHC inhibitor 2-BP in HEK293T cells. Relative stearoylation level of Vangl2 is indicated. (H) Overexpression of thioesterase APT1, but not APT2, substantially decreased Vangl2 stearoylation in HEK293T cells. Relative stearoylation level of Vangl2 is indicated. (I) Co-IP assay showed the direct interactions between APT1 and Vangl2 in HEK293T cells. Relative HA-APT1/2 protein level is indicated from the IP-Flag samples. (J) Streptavidin bead pulldown showed that the pan-APT inhibitor Palmostatin B (Palm B) treatment could increase Vangl2 stearoylation level in HEK293T cells. Relative stearoylation level of Vangl2 is indicated. (K) Streptavidin bead pulldown showed that the APT1 inhibitor ML348, but not APT2 inhibitor ML349, could substantially increase Vangl2 stearoylation in HEK293T cells. Relative stearoylation level of Vangl2 is indicated. All blots are representatives of at least three independent experiments.
Fig. 3.
Fig. 3.
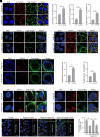
Stearoylation of Vangl2 regulates Vangl2 membrane localization and PCP establishment during cell migration. (A) Immunofluorescence (IF) assay showed subcellular localization of Vangl2 in MCF10A stable cells under monolayer culture conditions. The C103S mutation disrupted Vangl2 membrane localization in MCF10A cells. Cells were stained with anti-E-Cadherin antibody (red), anti-Flag antibody (green), and DAPI (blue). (Scale bar,10 μm.) (B) The colocalization ratio between Vangl2 and E-Cadherin was quantified. At least 200 cells were counted for each cell line. (C) IF assay showed the colocalization of Vangl2 WT or the C103S mutant and the Golgi marker GM130 in MCF10A cells. Cells were stained with anti-GM130 antibody (red), anti-Flag antibody (green), and DAPI (blue). (Scale bar, 2 μm.) (D) The colocalization ratio between Vangl2 and GM130 was quantified. At least 200 cells were counted for each cell line. (E) IF assay showed the colocalization of Vangl2 WT or the C103S mutant and the ER marker Calnexin in MCF10A cells. Cells were stained with anti-Calnexin antibody (red), anti-Flag antibody (green), and DAPI (blue). (Scale bar, 2 μm.) (F) The colocalization ratio between Vangl2 and Calnexin was quantified. At least 200 cells were counted for each cell line. (G) IF assay showed the colocalization of Vangl2 WT or the C103S mutant and GM130 in MCF10A cells under 3D culture conditions. Cells were stained with anti-GM130 antibody (red), anti-Flag antibody (green), and DAPI (blue). (Scale bar,10 μm.) (H) High-resolution image showed the colocalization of Vangl2 WT or the C103S mutant and GM130 in MCF10A cells under 3D culture conditions. Zoomed-in image of the area enclosed by the white dotted line box in (G). (Scale bar, 2 μm.) (I) The percentage of acini with Vangl2 and GM130 colocalization was quantified. At least 100 acini were counted for each cell line. (J) High-resolution IF image showed the colocalization of Vangl2 WT or the C103S mutant and PDI in MCF10A cells under 3D culture conditions. Cells were stained with anti-PDI antibody (red), anti-Flag antibody (green), and DAPI (blue). (Scale bar, 2 μm.) (K) The percentage of acini with Vangl2 and PDI colocalization was quantified. At least 100 acini were counted for each cell line. (L) IF assay showed GM130 orientation in the wound edge cells using the indicated MCF10A stable cells at 20 h postscratch. Cells were stained with anti-GM130 antibody (red), anti-Flag antibody (green), and DAPI (blue). The dotted line indicates the wound edge. (Scale bar,10 μm.) (M) Quantification of the percentage of the normal-oriented cells at the wound edge. At least 400 cells were counted for each cell line. All data are represented as mean ± SEM, n = 3. P values were determined using two-tailed t-tests. ***, P < 0.001.
Fig. 4.
Fig. 4.
ZDHHC9 is required for Vangl2 membrane localization and PCP establishment during cell migration. (A) IF assay showed that ZDHHC9 knockout (KO) substantially decreased Vangl2 membrane localization in MCF10A cells. The cells were stained with anti-E-Cadherin antibody (red), anti-Flag antibody (green), and DAPI (blue). (Scale bar, 10 μm.) (B) Quantification of the colocalization ratio between Vangl2 and E-Cadherin. At least 200 cells were counted for each cell line. (C) IF assay showed the colocalization of Vangl2 and GM130 in the indicated MCF10A cells. Cells were stained with anti-GM130 antibody (red), anti-Flag antibody (green), and DAPI (blue). (Scale bar, 2 μm.) (D) The colocalization ratio between Vangl2 and GM130 was quantified. At least 200 cells were counted for each cell line. (E) IF assay showed the colocalization of Vangl2 and Calnexin in the indicated MCF10A cells. Cells were stained with anti-Calnexin antibody (red), anti-Flag antibody (green), and DAPI (blue). (Scale bar, 2 μm.) (F) The colocalization ratio between Vangl2 and Calnexin was quantified. At least 200 cells were counted for each cell line. (G) IF assay showed that blocking Vangl2 stearoylation with 30 µM of 2-BP disrupted Vangl2 membrane localization in MCF10A cells. The cells were stained with anti-E-Cadherin antibody (red), anti-Flag antibody (green), and DAPI (blue). (Scale bar, 10 μm.) (H) Quantification of the colocalization ratio between Vangl2 and E-Cadherin. At least 200 cells were counted for each cell line. (I) IF assay showed the colocalization of Vangl2 and GM130 in MCF10A cells with 2-BP treatment. Cells were stained with anti-GM130 antibody (red), anti-Flag antibody (green), and DAPI (blue). (Scale bar, 2 μm.) (J) The colocalization ratio between Vangl2 and GM130 was quantified. At least 200 cells were counted for each cell line. (K) IF assay showed the colocalization of Vangl2 and Calnexin in MCF10A cells with 2-BP treatment. Cells were stained with anti-Calnexin antibody (red), anti-Flag antibody (green), and DAPI (blue). (Scale bar, 2 μm.) (L) The colocalization ratio between Vangl2 and Calnexin was quantified. At least 200 cells were counted for each cell line. (M) IF assay showed Golgi orientation in the wound edge cells using MCF10A stable cells with ZDHHC9 KO or 2-BP treatment at 20 h postscratch. Cells were stained with anti-GM130 antibody (red), anti-Flag antibody (green), and DAPI (blue). The dotted line indicates the wound edge. (Scale bar, 10 μm.) (N) Quantification of the percentage of the normal-oriented cells at the wound edge. At least 400 cells were counted for each cell line. All data are represented as mean ± SEM, n > 3. P values were determined using two-tailed t tests. ***P < 0.001.
Fig. 5.
Fig. 5.
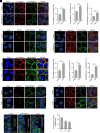
Loss of Vangl2 stearoylation promotes the activation of YAP, AKT, and ERK signaling. (A) Western blot showed that phosphorylation level of YAP, AKT, ERK, and MEK in the indicated HCC1806 stable cells. Relative Vangl2 protein level and phosphorylation level of YAP, AKT, ERK, and MEK are indicated. (B) Co-IP showed the interaction between Vangl2 and YAP in HCC1806 cells. Relative Vangl2 and YAP protein levels are indicated from the co-IP samples. (C) RT-PCR showed YAP target gene expression in the indicated HCC1806 stable cells. Relative mRNA expression was normalized to vector control. (D) IF assay showed YAP localization in HCC1806 cells. The cells were stained with anti-YAP antibody (green), TRITC phalloidin for F-actin (red), and DAPI (blue). (Scale bar, 10 μm.) (E) Quantification of YAP nuclear/cytoplasmic (N/C) ratio. At least 100 cells were counted for each cell line. All data are represented as mean ± SEM, n > 3. P values were determined using two-tailed t tests. NS, not significant, *P < 0.05, ***P < 0.001.
Fig. 6.
Fig. 6.
Loss of Vangl2 stearoylation promotes breast cancer cell growth. (A) Colony formation assay using the indicated HCC1806 stable cells. (B) Quantification of the colony number in the indicated HCC1806 stable cell lines. (C) Representative images of HCC1806 stable cells cultured under 3D conditions for 6 d. (Scale bar,100 μm.) (D) Quantification of the average area of the acini in the indicated stable cell line. At least 100 acini were analyzed for each cell line in three independent experiments. (E) Representative images of HCC1806 cells in the EdU assay. (F) Quantification of cell proliferation index by calculating the EdU positive (EdU+) cells in the indicated HCC1806 cells. All data are represented as mean ± SEM, n > 3. P values were determined using two-tailed t tests. NS, not significant, *P < 0.05, **P < 0.01, ***P < 0.001.
Fig. 7.
Fig. 7.
Loss of Vangl2 stearoylation enhances HRasV12-induced oncogenic transformation. (A) Transwell migration assay showing the migratory response in the indicated MCF10A stable cell lines. (Scale bar, 50 μm.) (B) Quantification of the number of migratory cells in the indicated MCF10A stable cell lines. (C) Representative images of the indicated MCF10A stable cells cultured in Matrigel for 4 d. (Scale bar, 25 μm.) (D) Quantification of the percentage of acini with invasive protrusions in the indicated MCF10A cell lines. At least 100 acini were analyzed for each cell line in three independent experiments. All data are represented as mean ± SEM, n > 3. P values were determined using two-tailed t tests. ***P < 0.001.

Similar articles

References

    1. Zallen J. A., Planar polarity and tissue morphogenesis. Cell 129, 1051–1063 (2007). - PubMed
    1. Butler M. T., Wallingford J. B., Planar cell polarity in development and disease. Nat. Rev. Mol. Cell Biol. 18, 375–388 (2017). - PMC - PubMed
    1. Torban E., Sokol S. Y., Planar cell polarity pathway in kidney development, function and disease. Nat. Rev. Nephrol. 17, 369–385 (2021). - PMC - PubMed
    1. Luga V., et al. , Exosomes mediate stromal mobilization of autocrine Wnt-PCP signaling in breast cancer cell migration. Cell 151, 1542–1556 (2012). - PubMed
    1. Montcouquiol M., et al. , Identification of Vangl2 and Scrb1 as planar polarity genes in mammals. Nature 423, 173–177 (2003). - PubMed

MeSH terms

LinkOut - more resources