. 2024 Jul;631(8022):899-904.
doi: 10.1038/s41586-024-07610-x. Epub 2024 Jun 5.

Structure and topography of the synaptic V-ATPase-synaptophysin complex

Affiliations

Structure and topography of the synaptic V-ATPase-synaptophysin complex

Chuchu Wang et al. Nature. 2024 Jul.

Abstract

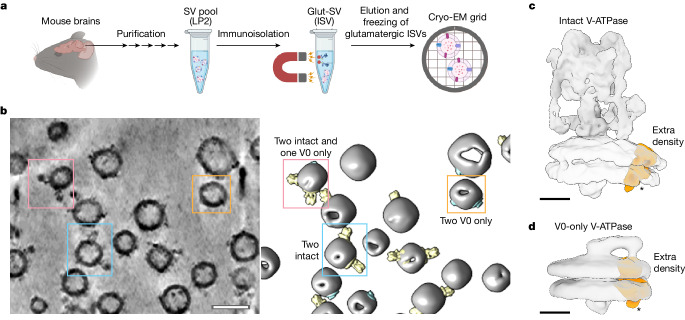
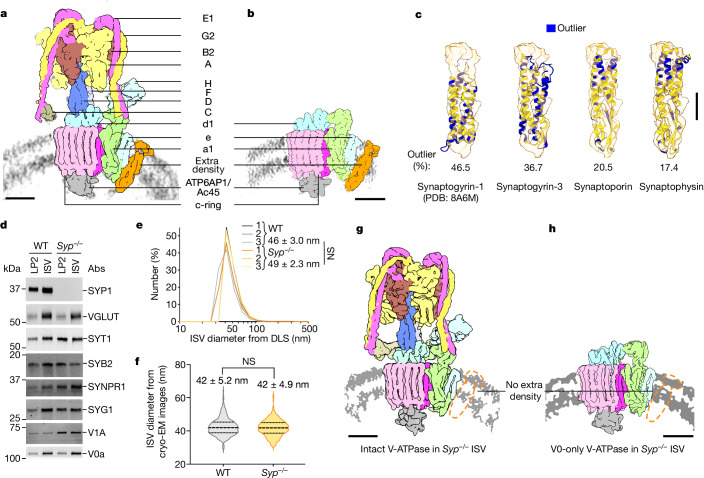
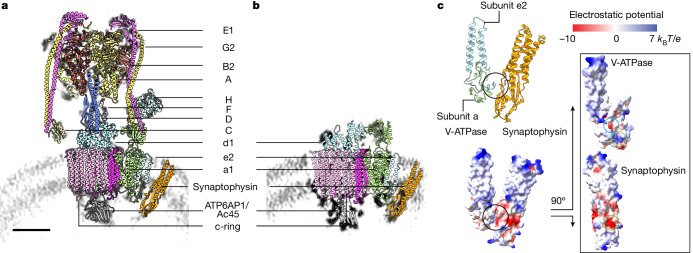
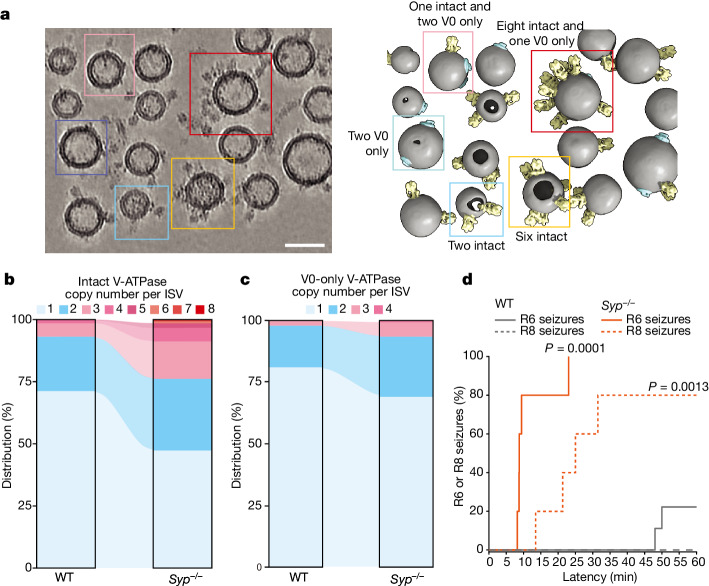
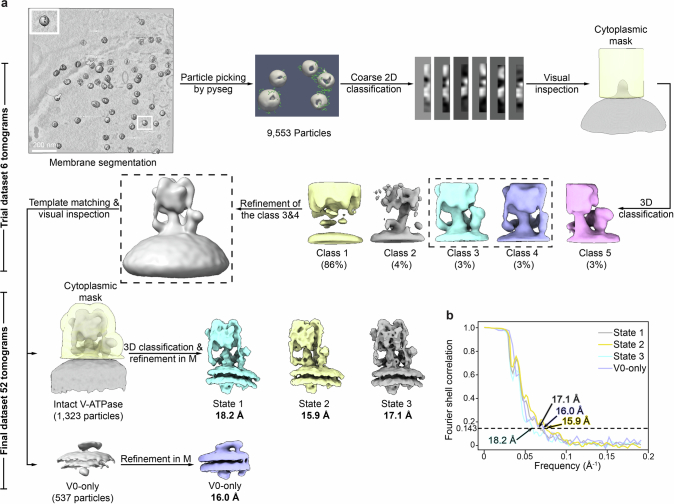
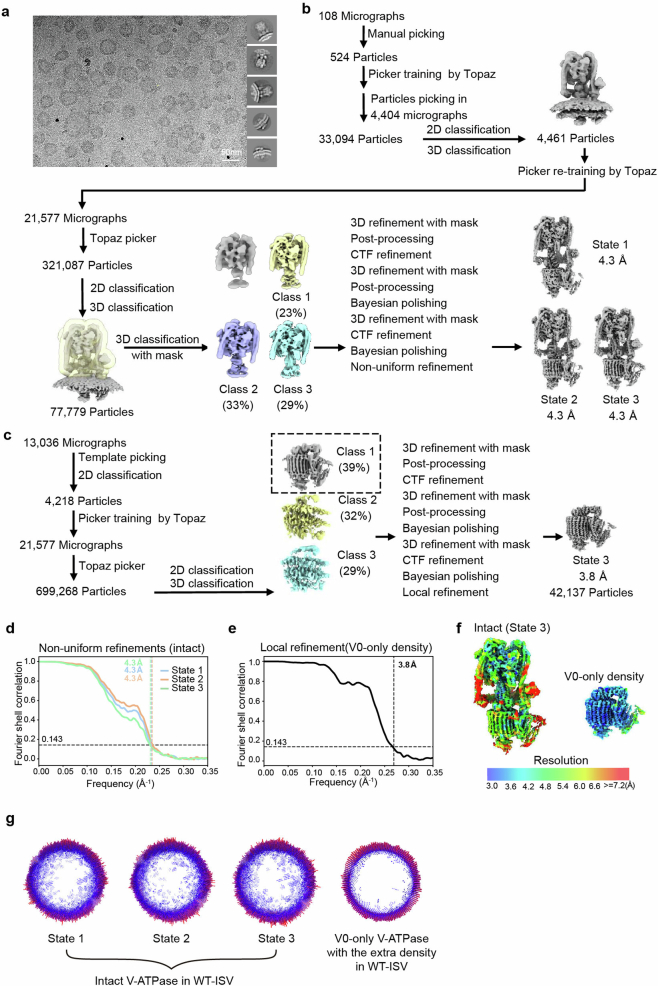
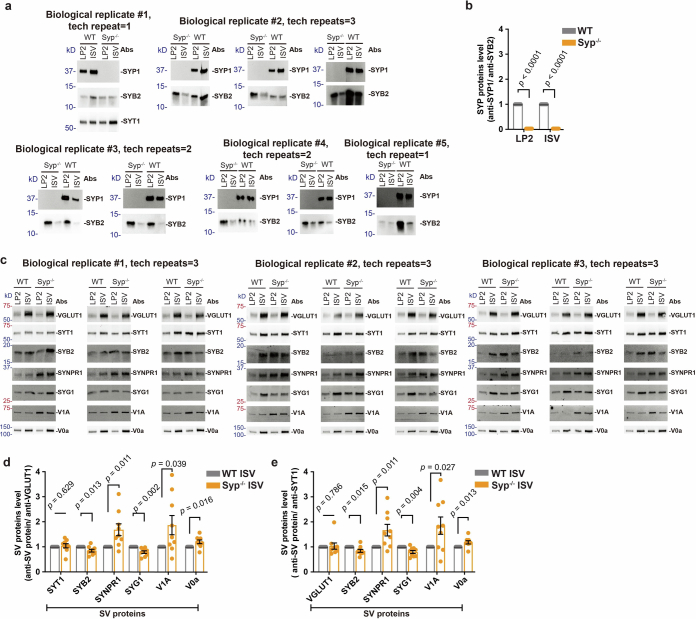
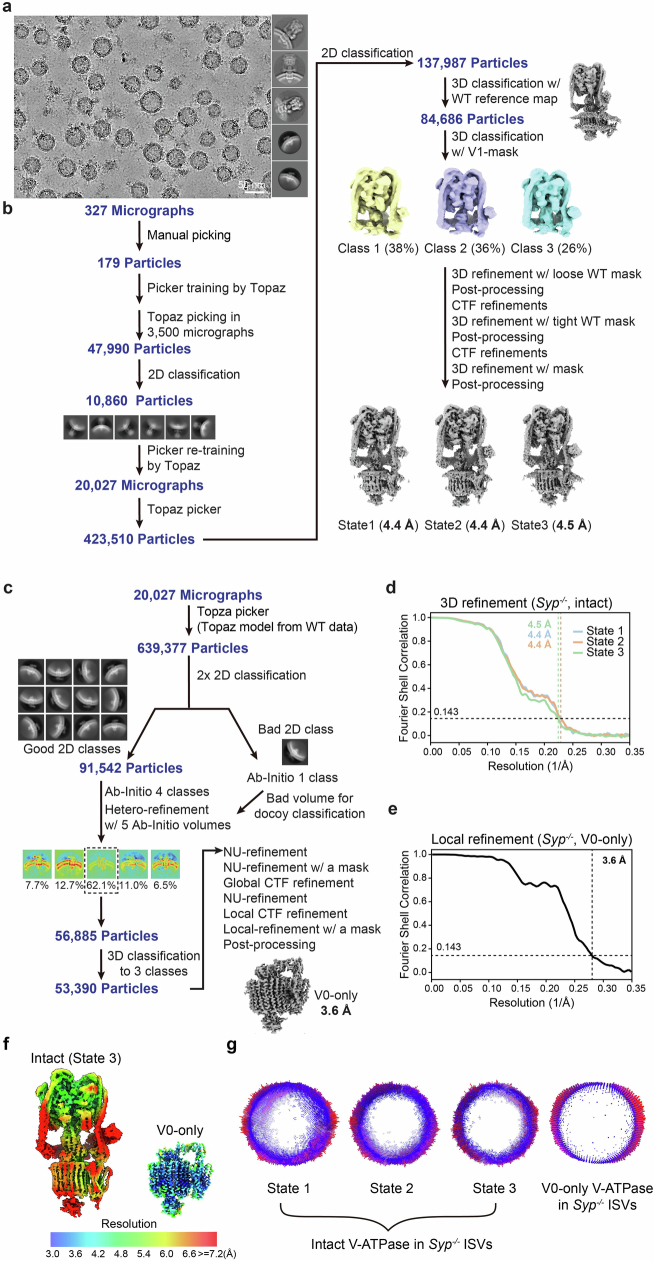
Synaptic vesicles are organelles with a precisely defined protein and lipid composition1,2, yet the molecular mechanisms for the biogenesis of synaptic vesicles are mainly unknown. Here we discovered a well-defined interface between the synaptic vesicle V-ATPase and synaptophysin by in situ cryo-electron tomography and single-particle cryo-electron microscopy of functional synaptic vesicles isolated from mouse brains3. The synaptic vesicle V-ATPase is an ATP-dependent proton pump that establishes the proton gradient across the synaptic vesicle, which in turn drives the uptake of neurotransmitters4,5. Synaptophysin6 and its paralogues synaptoporin7 and synaptogyrin8 belong to a family of abundant synaptic vesicle proteins whose function is still unclear. We performed structural and functional studies of synaptophysin-knockout mice, confirming the identity of synaptophysin as an interaction partner with the V-ATPase. Although there is little change in the conformation of the V-ATPase upon interaction with synaptophysin, the presence of synaptophysin in synaptic vesicles profoundly affects the copy number of V-ATPases. This effect on the topography of synaptic vesicles suggests that synaptophysin assists in their biogenesis. In support of this model, we observed that synaptophysin-knockout mice exhibit severe seizure susceptibility, suggesting an imbalance of neurotransmitter release as a physiological consequence of the absence of synaptophysin.


Conflict of interest statement

The authors declare no competing interests.

Figures

Fig. 1
Fig. 1. Cryo-ET of glutamatergic ISVs.
a, Schematic overview of glutamatergic synaptic vesicle isolation and cryo-EM sample preparation (Methods). LP2, second lysis pellet. Schematic overview in a was created using BioRender (https://biorender.com). b, A representative tomogram (1 of 52 tomograms) (cryoCARE denoised) of ISVs is shown as a tomographic slice (left; thickness 1 nm) with a corresponding 3D rendering (right; Methods). The ISV membrane, intact and V0-only V-ATPase assemblies are coloured in grey, yellow and cyan, respectively. Three representative ISVs are boxed and annotated with the copy numbers of intact and V0-only V-ATPase assemblies. Scale bar, 50 nm. c,d, Subtomogram averaging maps (Methods and Extended Data Fig. 1) of intact (c; state 3) and V0-only (d) V-ATPase assemblies (transparent surfaces). The extra binding partner density (not part of the V-ATPase assembly) is coloured in orange and denoted with an asterisk. Scale bars, 5 nm.
Fig. 2
Fig. 2. Maps of V-ATPases imaged in wild-type and Syp−/− ISVs.
a,b, SPA maps of intact (a; state 3) and V0-only (b) V-ATPase assemblies imaged in wild-type (WT) ISVs. The V-ATPase subunits are coloured as indicated, and the extra binding partner density is coloured in orange. The background grey arc represents the ISV membrane density. Scale bars, 5 nm. c, Docking of models into the binding partner density (orange) extracted from the map shown in a. The solution NMR structure of synaptogyrin-1 and the AlphaFold2 predicted atomic models of synaptogyrin-3, synaptoporin and synaptophysin are shown. The atomic models are shown in cartoon representation and coloured in yellow and blue to indicate if the model is in the interior or the exterior of the map, respectively. For clarity, only the transmembrane and luminal parts are displayed, omitting the cytosolic regions that are predicted to be unstructured. Scale bar, 5 nm. d, Representative western blots (one of nine independent measurements) of synaptic proteins in LP2 and ISV samples from wild-type and Syp−/− ISVs (Extended Data Fig. 4). Abs, antibodies. e, Dynamic light scattering (DLS) measurements of wild-type and Syp−/− ISVs. The means and standard deviations of the ISV diameters were calculated from three independent ISV preparations. P-values were calculated by the unpaired two-tailed t-test. NS, not significant. f, Size distribution analysis of wild-type and Syp−/− ISVs by inspection of cryo-EM images. The mean ± s.d. of wild-type and Syp−/− ISV diameters were calculated from 326 wild-type ISVs and 362 Syp−/− ISVs, respectively. In the violin plots, the bottom dotted line represents the first quartile, the middle dashed line represents the median, and the top dotted line represents the third quartile. P-values were calculated by unpaired two-tailed t-test. g,h, SPA maps of intact (g; state 3) and V0-only (h) V-ATPase assemblies imaged in Syp/ ISVs. The V-ATPase subunits are coloured as in a and b. The corresponding location of the binding partner density identified in wild-type ISVs is indicated as a dashed orange silhouette for comparison. The background grey arc represents the ISV membrane density. Scale bars, 5 nm. Source Data
Fig. 3
Fig. 3. Structures of V-ATPases imaged in wild-type ISVs.
a,b, Atomic models of the V-ATPase–synaptophysin complex imaged in wild-type ISVs. The intact (a; state 3) and V0-only (b) V-ATPase assemblies are shown. The V-ATPase subunits are coloured as indicated, and synaptophysin is coloured in orange. The background grey arc represents the ISV membrane density. Scale bar, 5 nm (the same scale bar is used in a and b). c, Interface (black circle) between V-ATPase subunits e2, a and synaptophysin (the structure of the V0-only V-ATPase assembly of wild-type ISVs). The electrostatic surface potential of this interface is also shown along with an ‘open book’ view. The blue and green circles highlight the interface between synaptophysin and V-ATPase subunit e2 and a, respectively. The interface area is approximately 350 Å2.
Fig. 4
Fig. 4. Increase of V-ATPase copy numbers and seizures in Syp−/− mice.
a, A representative tomogram (1 of 78 tomograms; cryoCARE denoised) of ISVs from Syp−/− mouse brains is shown as a tomographic slice (left; thickness of 35.5 nm) with a corresponding 3D rendering (right). The ISV membrane, and the intact and V0-only V-ATPase assemblies are coloured in grey, yellow and cyan, respectively. Five representative ISVs are boxed and labelled, with the copy number of intact and V0-only V-ATPase assemblies identified within each. More examples and views are shown in Extended Data Fig. 8a,b. Scale bar, 50 nm. b,c, Distribution of intact (b) and V0-only (c) V-ATPase copy number per wild-type ISV or Syp−/− ISV. Statistical significance tests are shown in Extended Data Fig. 8d,e, and numerical data are available in Supplementary Tables 4 and 5. d, Mice of 4–6 months of age of two genotypes (wild-type (n = 9) and Syp−/− (n = 5)) were injected with kainic acid (25 mg kg−1 intraperitoneally) and observed for 60 min with video recording. Seizure severity was scored blind by two observers using a modified Racine scale, and the latency survival to R6 or R8 seizure severity is reported (Methods). **P = 0.0013 and ***P < 0.0001 (one-sided Gehan–Breslow–Wilcoxon test). Source Data
Extended Data Fig. 1
Extended Data Fig. 1. Workflow of subtomogram averaging of V-ATPase assemblies in wildtype ISVs (related to Fig. 1).
a, Workflow of particle picking, subtomogram averaging, and classification of intact and V0-only V-ATPase assemblies (see Methods). b, Gold-standard Fourier shell correlation (FSC) curves of the resulting subtomogram average maps.
Extended Data Fig. 2
Extended Data Fig. 2. Single-particle averaging workflow of V-ATPase assemblies in wild-type ISVs (related to Fig. 3).
a, Representative micrograph (one of 21,577 micrographs) of ISVs and V-ATPase assemblies 2D classification averages. The micrograph was Topaz-denoised for better visualization. b&c, Cryo-EM image processing workflow of (b) intact V-ATPase assemblies in three rotational states and (c) V0-only V-ATPase assemblies (see Methods). d&e, Gold-standard FSC curves of the intact V-ATPase assembly in three rotational states and of the V0-only V-ATPase assembly. f, Refined maps of intact V-ATPase State 3 and V0-only V-ATPase assemblies, colored according to local resolution estimated in cryoSPARC (see Methods). g, Particle orientation distributions of intact V-ATPase assemblies in three rotational states and V0-only V-ATPase assemblies (see Methods). The orientational distributions should adequately sample Fourier space.
Extended Data Fig. 3
Extended Data Fig. 3. Western blots of synaptic proteins in wild-type and Syp−/− samples (related to Fig. 2).
a&b, Western blots of (a) synaptophysin in LP2 and ISV samples from wild-type and Syp−/− mouse brains, and (b) quantification. Blotting was performed with antibodies (Abs) for synaptophysin-1 (SYP1) (for Syp−/− validation), synaptobrevin-2 (SYB2), and synaptotagmin-1 (SYT1). (b) For each antibody and blot repeat, the band densities for Syp−/− LP2 and Syp−/− ISVs were first normalized to the respective band densities of wild-type LP2 and wild-type ISV, respectively. The synaptophysin-1 density of Syp−/− LP2 and Syp−/− ISV was then normalized to the synaptobrevin-2 density of wild-type LP2 and wild-type ISV, respectively. Data are presented as mean ± SEM; error bars (black) represent the SEM of nine independent measurements (biological and technical repeat numbers are specified in the figure); p-values are indicated in the figure and calculated by unpaired two-tailed t-test (n = 9), *** p < 0.001. c&d, Western blots of (c) synaptic proteins in LP2 and ISV samples from wild-type and Syp−/− ISVs mouse brains, followed by quantification (d, e). Blotting was performed with antibodies (Abs) for synaptotagmin-1 (SYT1), vesicular glutamate transporter-1 (VGLUT1), synaptoporin-1 (SYNPR1), synaptogyrin-1 (SYG1), subunit A of the V-ATPase V1 assembly (V1A), and subunit a of the V-ATPase V0 assembly (V0a). (e) For each antibody and blot repeat, the band densities for Syp−/− ISV were first normalized to the respective band densities of wild-type ISVs. The synaptic protein densities of Syp−/− ISVs were then normalized to the SYT1 (d) or VGLUT1 (e) densities in wild-type ISVs, respectively. Data are presented as mean ± SEM; error bars (black) represent the SEM of nine independent measurements (biological and technical repeat numbers are specified in the figure); p-values are indicated in the figure and calculated by unpaired two-tailed t-test (n = 9), *p < 0.05, ** p < 0.01. Unprocessed blots and source numerical data are available in Source Data. Source Data
Extended Data Fig. 4
Extended Data Fig. 4. Single-particle averaging workflow of V-ATPase assemblies in Syp−/− ISVs.
a, Representative micrograph (one of 20,027 micrographs) of Syp−/− ISVs and V-ATPase 2D classification averages. The micrograph was Topaz-denoised for better visualization. b&c, Cryo-EM image processing workflow of (b) intact V-ATPase assemblies in three rotational states and (c) V0-only V-ATPase assemblies in Syp−/− ISVs (see Methods). d&e, Gold-standard FSC curves of intact V-ATPase assemblies in three rotational states and V0-only V-ATPase assemblies in Syp−/− ISVs. f, Refined maps of intact V-ATPase State 3 and V0-only V-ATPase assemblies colored according to local resolution estimated in RELION and cryoSPARC (see Methods). g, Orientation distributions for the particles of intact V-ATPase assemblies in three rotational states and V0-only V-ATPase assemblies in Syp−/− ISVs (see Methods).
Extended Data Fig. 5
Extended Data Fig. 5. Examples of map quality and atomic model fits (related to Fig. 3).
a, Models of subunits A, B2, G2, D, and E1 superimposed on the wild-type intact V-ATPase map. b, Models of subunits c’ and d superimposed on the wild-type intact V-ATPase map. c, Models of subunits ATP6AP1/AC45 and ATP6AP2/PRR superimposed on the wild-type intact V-ATPase map. d, Model of the ATP6AP1 luminal domain superimposed on the wild-type V0-only V-ATPase map. Potential glycosylated sites are shown and annotated using a stick model.
Extended Data Fig. 6
Extended Data Fig. 6. Analysis of the V-ATPase–synaptophysin interface (related to Fig. 3).
a, Upper: primary sequence alignment of V-ATPase subunit e1 (ATP6V0E1) and e2 (ATP6V0E2). Representative residues of V-ATPase subunit e2 that differ from e1 are highlighted. Lower: Superposition of the structure and the map for the V0-only V-ATPase assembly in Syp−/− ISVs (we used the Syp−/− data since it produced the highest resolution for the V0 domain). b, SPA map of subunits e2 (blue), a (green) and synaptophysin (orange) for the V0-only V-ATPase assembly of wild-type ISVs. The inset shows a close-up view. c, The atomic model of synaptophysin fitted into the V0-only V-ATPase map of wild-type ISVs (see Methods) is colored according to the primary sequence conservation score compared with synaptoporin. The inset shows a close-up view. d, Primary sequence alignment of synaptophysin and synaptoporin. Red-shaded regions indicate strictly conserved residues, and blue boxes indicate conserved residues. Thick blue and pink stripes indicate the transmembrane and luminal domains of synaptophysin and synaptoporin, respectively. The V-ATPase–synaptophysin interface region is annotated with a green box.
Extended Data Fig. 7
Extended Data Fig. 7. Comparison of V-ATPase structures in wild-type and Syp−/− ISVs (related to Fig. 3).
a, Superposition of wild-type and Syp−/− intact State 1, State 2, State 3, and V0-only V-ATPase assemblies (from left to right). Models were aligned globally. Most of the larger differences are in regions that are poorly determined in the maps.
Extended Data Fig. 8
Extended Data Fig. 8. V-ATPase copy numbers from wild-type and Syp−/− mouse brains (related to Fig. 4).
a&b, Representative tomographic slices of Syp−/− ISVs (one of 78 tomograms) (a, upper) or wild-type ISVs (one of 156 tomograms) (b, bottom) (thickness = 0.9 nm), respectively (obtained from Wiener filtered tomograms). Four representative ISVs are selected (colored boxed), and a series of higher magnification tomographic Wiener-filtered planes of each ISV are shown below and annotated with yellow and green arrows for intact and V0-only V-ATPase assemblies, respectively. Scale bars: 50 nm. c, Scatter plot of the ISV diameters and V-ATPase copy numbers (including both intact and V0-only assemblies) for wild-type and Syp−/− ISVs from 6 randomly selected tomograms, respectively. d&e, Bootstrapping statistical significance tests (see Methods) for intact (c) or V0-only (d) V-ATPase copy number per ISV from wild-type and Syp−/− mouse brains. The data were resampled 10,000 times with replacement to estimate the mean and standard deviation of each intact or V0-only V-ATPase assembly copy number group. For the intact V-ATPase assembly (Supplementary Table 4), the wild-type ISV and Syp−/− ISV sample pool comprises 1,326 ISVs and 1,453 ISVs, respectively. For the V0-only V-ATPase assembly (Supplementary Table 5), the wild-type ISV and Syp−/− ISV sample pool comprises 106 ISVs and 188 ISVs, respectively. Data are presented as mean ± SD; error bars (black) represent the SD of 10,000 statistically independent sampling; *** p < 0.001 by Student’s t-test (n = 10,000). f, g, h & i, Fitted Poisson distribution for the copy numbers of intact V-ATPase assemblies for ISVs from wild-type (f) and Syp−/− mouse brains (g), and to the copy numbers of the V0-only V-ATPase assemblies for ISVs from wild-type (h) and Syp−/− mouse brains (i). The Poisson distributions were fitted to the observed copy numbers ≥ 1, i.e., the copy numbers of ISVs without any V-ATPase were not used for the fit (see Methods). The least-squares residuals shown in the figure legends refer to copy numbers ≥ 1. Source numerical data are in Source Data. Source Data

Similar articles

Cited by

References

    1. Takamori, S. et al. Molecular anatomy of a trafficking organelle. Cell127, 831–846 (2006). - PubMed
    1. Grønborg, M. et al. Quantitative comparison of glutamatergic and GABAergic synaptic vesicles unveils selectivity for few proteins including MAL2, a novel synaptic vesicle protein. J. Neurosci.30, 2–12 (2010). - PMC - PubMed
    1. Leitz, J. et al. Beyond the MUN domain, Munc13 controls priming and depriming of synaptic vesicles. Cell Rep.10.1016/j.celrep.2024.114026 (2024). 10.1016/j.celrep.2024.114026 - DOI - PMC - PubMed
    1. Bodzęta, A., Kahms, M. & Klingauf, J. The presynaptic v-ATPase reversibly disassembles and thereby modulates exocytosis but is not part of the fusion machinery. Cell Rep.20, 1348–1359 (2017). - PubMed
    1. Casey, J. R., Grinstein, S. & Orlowski, J. Sensors and regulators of intracellular pH. Nat. Rev. Mol. Cell Biol.11, 50–61 (2010). - PubMed

MeSH terms

LinkOut - more resources