. 2024 May 25;15(1):4469.
doi: 10.1038/s41467-024-48959-x.

Rab30 facilitates lipid homeostasis during fasting

Affiliations

Rab30 facilitates lipid homeostasis during fasting

Danielle M Smith et al. Nat Commun. .

Abstract

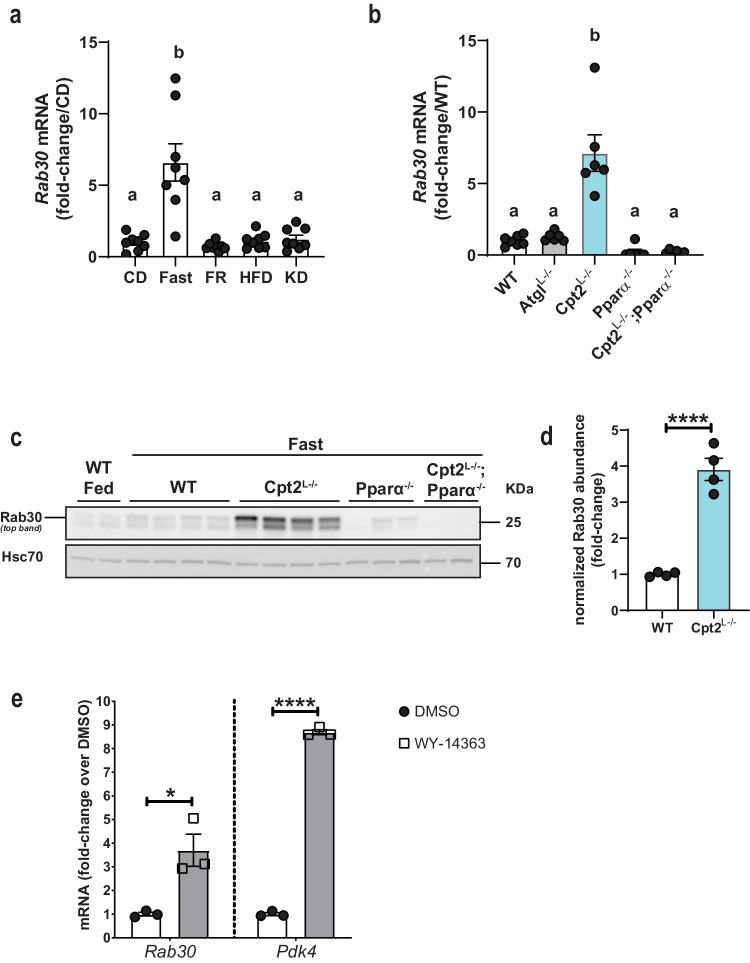
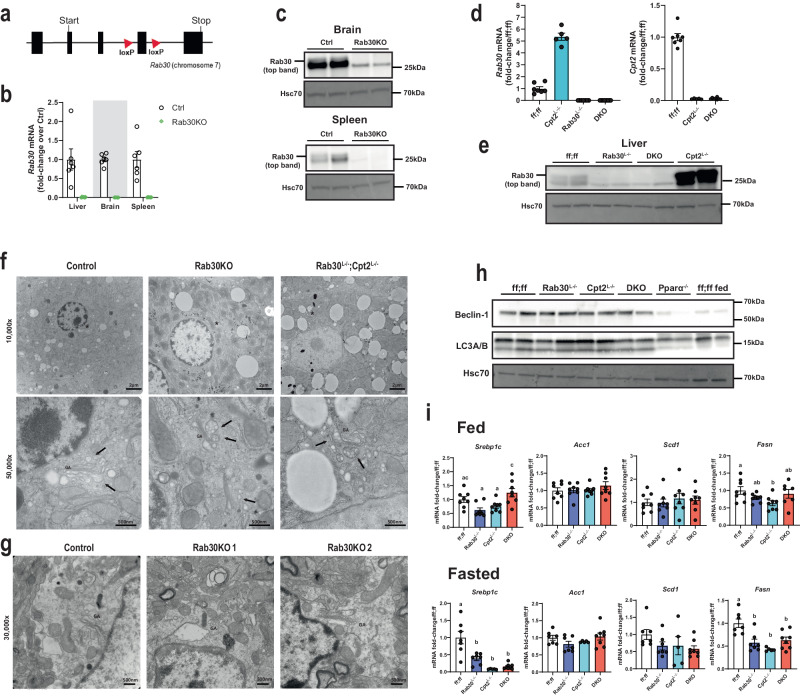
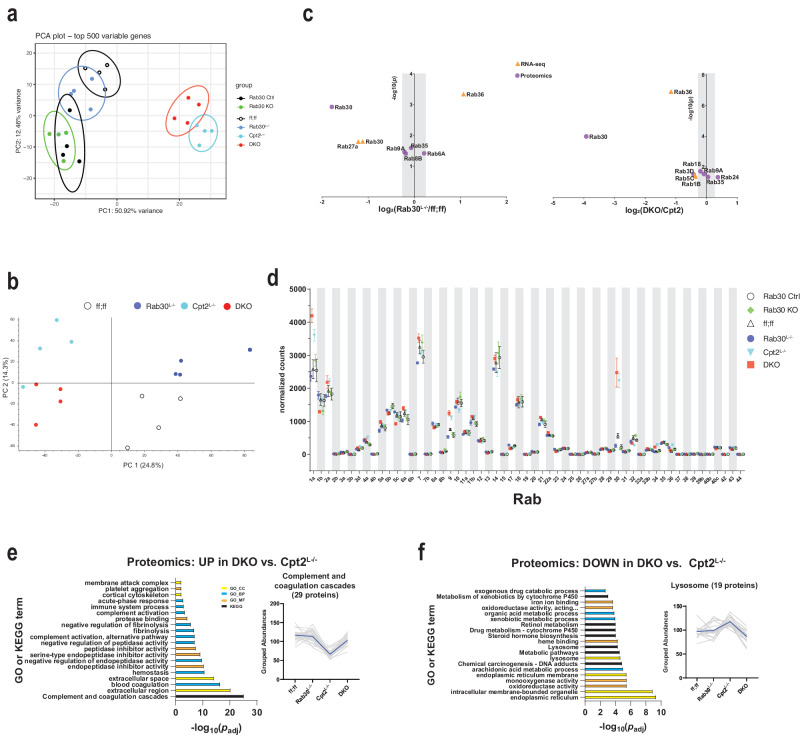
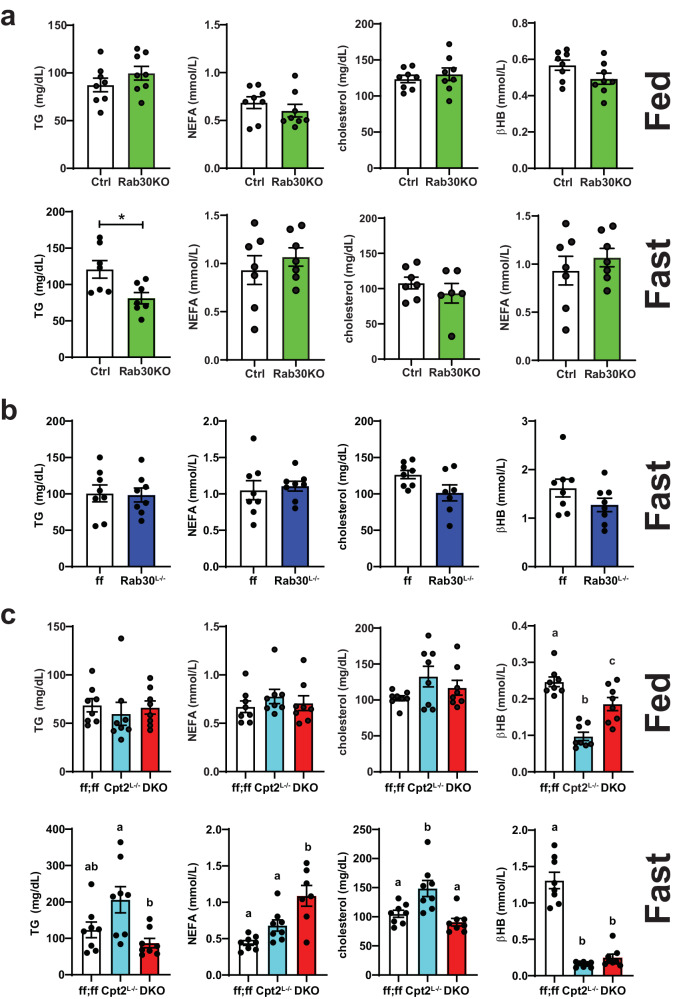
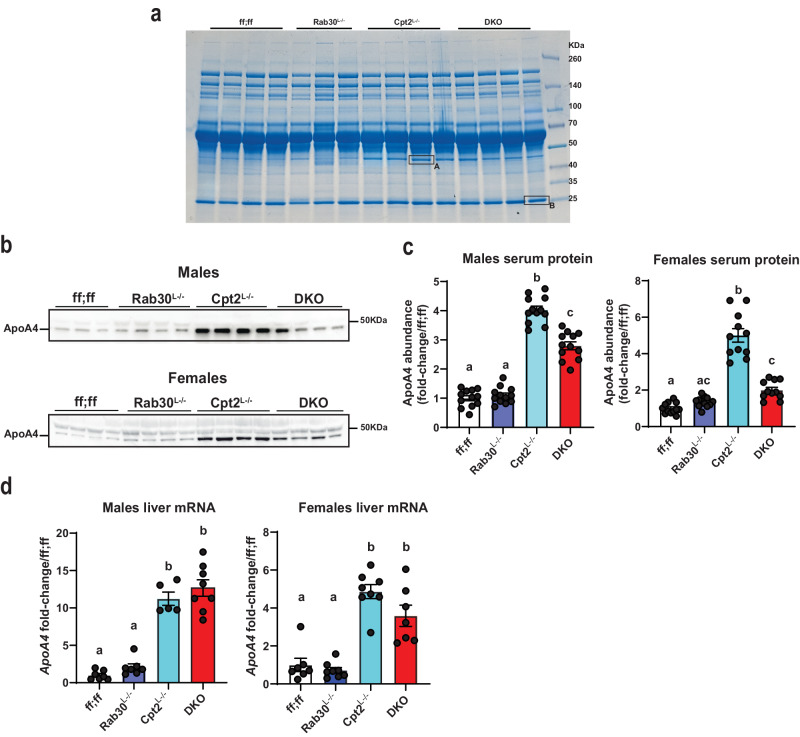
To facilitate inter-tissue communication and the exchange of proteins, lipoproteins, and metabolites with the circulation, hepatocytes have an intricate and efficient intracellular trafficking system regulated by small Rab GTPases. Here, we show that Rab30 is induced in the mouse liver by fasting, which is amplified in liver-specific carnitine palmitoyltransferase 2 knockout mice (Cpt2L-/-) lacking the ability to oxidize fatty acids, in a Pparα-dependent manner. Live-cell super-resolution imaging and in vivo proximity labeling demonstrates that Rab30-marked vesicles are highly dynamic and interact with proteins throughout the secretory pathway. Rab30 whole-body, liver-specific, and Rab30; Cpt2 liver-specific double knockout (DKO) mice are viable with intact Golgi ultrastructure, although Rab30 deficiency in DKO mice suppresses the serum dyslipidemia observed in Cpt2L-/- mice. Corresponding with decreased serum triglyceride and cholesterol levels, DKO mice exhibit decreased circulating but not hepatic ApoA4 protein, indicative of a trafficking defect. Together, these data suggest a role for Rab30 in the selective sorting of lipoproteins to influence hepatocyte and circulating triglyceride levels, particularly during times of excessive lipid burden.


Conflict of interest statement

The authors declare no competing interests.

Figures

Fig. 1
Fig. 1. Rab30 is induced in the mouse liver upon fasting by Pparα.
a Hepatic Rab30 mRNA from 20-week-old male C57Bl/6J mice under different dietary states. n = 8/group. CD control diet, Fast CD fed mice fasted overnight, FR CD fed mice fasted for 14 h then refed for 12 h; HFD high fat (60%) diet, KD ketogenic diet. Mice were placed on the respective diets for 12 weeks. Values are mean ± SEM relative to CD. Letters indicate significance groups, where different letters represent statistical significance of p < 0.05 following analysis by Tamhane’s T2 multiple comparisons test after Welch and Brown–Forsythe ANOVA. b Hepatic Rab30 mRNA in fasted male mice (n = 7 for WT, n = 6 for all other genotypes). Values are mean ± SEM relative to WT fasted. Letters indicate significance groups by Tukey’s multiple comparisons test following one-way ANOVA. WT = Cpt2 floxed. c Representative immunoblots of Rab30 expression in fed and 24 h fasted livers of male mice with Hsc70 as an equal protein loading control. WT = Rab30;Cpt2 floxed. d Quantitation of Rab30 band intensity of fasted WT and Cpt2L−/− samples (n = 4 males/genotype) in d, normalized to Hsc70 signal and represented as fold-change over WT signal. Values are mean ± SEM. Significance was determined by two-tailed unpaired t-test. ****p = 8.34 × 10−5. e Rab30 mRNA in primary mouse hepatocytes treated with DMSO vehicle control or the selective Pparα agonist WY-14643. Primary mouse hepatocytes (500,000 cells/one well of a 6-well plate) were treated with 10 μM WY-14643 or DMSO in Medium 199 supplemented with 10% FBS and 1% penicillin-streptomycin 100x solution for 16 h. Values are mean ± SEM relative to expression under control DMSO treatment. Significance was determined by two-tailed unpaired t-test comparing 3 wells of DMSO treated cells to 3 wells of WY-14643 treated cells for each gene. *p = 0.0167; ****p = 4.08 × 10−7. Pdk4 is a positive control for Pparα induction after WY-14643 administration. ANOVA tables and source data for relevant panels are provided as a Source Data file.
Fig. 2
Fig. 2. Rab30 is localized to dynamic membranes from the Golgi.
a Confocal microscopy image of AML12 cells stably expressing HA-mScarlet-Rab30 and stained with the live-cell Golgi marker C6-NBD-Ceramide. The experiment was repeated twice with cells in replicate wells. b Confocal microscopy image of mouse hepatocytes isolated from animals overexpressing with AAV8-mScarletI-Rab30 and stained with the live-cell Golgi marker C6-NBD-Ceramide and Hoechst 33342 nuclear stain. Experiment was performed once in replicate wells. c Zoomed-in image of a representative primary mouse hepatocyte overexpressing AAV8-mScarletI-Rab30 and stained with the live-cell Golgi marker C6-NBD-Ceramide from the experiment described in b. d Immunostaining of GM130 in 24 h fasted mouse liver tissue overexpressing AAV8-mScarletI-Rab30. Blue channel in the merge is Hoechst 33342 nuclear stain. The experiment was repeated in 2-3 sections from 2 different animals. e Still images from time lapse of primary mouse hepatocytes overexpressing AAV8-TBG-mScarletI-Rab30 following the progression of a putative mScarletI-Rab30-positive membrane protraction event (marked by red arrows) captured using the spinning disk confocal microscope CSU-W1 SoRa. 60x objective. The experiment was repeated twice with hepatocytes from 2 different animals. See also Supplementary Movies 1–3. f Volcano plot of proteins enriched in TurboID-Rab30 or -Cpt1a pulldowns. The bait proteins are highlighted in blue. Proteins detected exclusively in one pulldown are collapsed into one point marked in yellow. Significantly enriched proteins (padj < 0.05) are colored magenta for Rab30 and orange for Cpt1a. Statistical significance is reported as the adjusted p-value using the Benjamini–Hockberg correction for the false discovery rate (FDR). See Supplementary Data 2 for the list of proteins used to generate the plot. Source data are provided as a Source Data file.
Fig. 3
Fig. 3. Characterization of Rab30 knockout mice.
a Gene targeting strategy for the Rab30 gene, with loxP site insertion indicated by triangles. b Fasting Rab30 mRNA in the livers, brains, and spleens of whole-body Rab30 knockout male mice (Rab30KO) and littermates (Ctrl) (n = 6/genotype). Values are mean ± SEM relative to Ctrl for a given tissue. c Rab30 immunoblot in the brain and spleen of Rab30KO and control males. Hsc70 is an equal protein loading control. d Fasting hepatic qRT-PCR for Rab30 (left) and Cpt2 (right) mRNAs in male livers. Values are mean ± SEM relative to Rab30;Cpt2 floxed (ff;ff) animals. DKO = Rab30L−/−;Cpt2L−/−. n = 5 for Cpt2L−/−, n = 7 for ff;ff, and n = 8 for DKO. e Rab30 immunoblot in the livers of Rab30L−/−, Cpt2L−/−; DKO, and control (ff;ff) males. f Representative transmission electron micrographs of liver cells from 5–6-week-old 24 h fasted male knockouts and control males. Asterisks (*) in 10,000x denote region of 50,000x acquisition. GA, Golgi apparatus; arrows, vesicles. The experiment was performed in a total of 5 controls and 3 of each knockouts. g Representative transmission electron micrographs of hippocampi from 7-8-week-old control and 2 Rab30KO females under basal conditions taken at 30,000x. GA Golgi apparatus. The experiment was performed in a total of 3 females per genotype. h Western blot for autophagosome initiation markers in the livers of control fed male mice and fasted control (ff;ff), Rab30L−/−, Cpt2L−/−, Rab30;Cpt2 DKO, and Pparα−/− male mice. Hsc70 is a protein loading control. i qRT-PCR of Srebp1c, Acc1, Scd1, and Fasn in fed and fasted livers of control (ff;ff), Rab30L−/−, Cpt2L−/−, and DKO males. n = 8/genotype for fed. n = 5 for Cpt2L−/−, n = 7 for ff;ff and Rab30L−/−, and n = 8 for DKO for fast. Values are mean ± SEM. Letters indicate significance groups by Tukey’s multiple comparisons test following one-way ANOVA for each individual gene. ANOVA tables and source data for relevant panels are provided as a Source Data file.
Fig. 4
Fig. 4. RNA-seq and proteomics analysis of 24 h fasted livers.
a Principal component analysis of RNA-seq on 24 h fasted livers from Rab30;Cpt2 floxed (ff;ff), Rab30KO littermate controls (Ctrl), Rab30L−/−, Cpt2L−/−, DKO, and Rab30KO male mice (n = 4/genotype). b Principal component analysis of proteomics on 24 h fasted livers from Rab30;Cpt2 floxed (ff;ff), Rab30L−/− (Rab30), Cpt2L−/−, and DKO mice (n = 4/genotype). c Volcano plot of significantly differentially expressed Rabs between Rab30L−/− and control (ff;ff) or DKO and Cpt2L-/− 24 h fasted livers in the RNA-seq (orange triangle) and proteomics (purple circle) datasets. Points outside of the gray bar represents a fold-change of at least 1.2. d Normalized read counts of Rab family members in RNA-seq of 24 h fasted livers. Values are the average of 4 samples/genotype ± SEM. Gene ontology and KEGG pathway analysis of proteomics comparing up- (e) and down- (f) regulated pathways in the DKO vs. Cpt2L−/−. Proteins with fold-change of at least 1.2 and p < 0.05 were submitted for pathway analysis to the DAVID functional annotation tool. Significantly enriched pathway terms are ranked against the Benjamini-adjusted p-value generated by the DAVID functional annotation tool. Top 20 terms by padj are presented. Colors represent pathway class as denoted in the legend. Normalized and scaled abundances vs. genotype plots depict the traces of all identified proteins within the given pathway, with the black line indicating the average grouped abundance of the proteins. For (e) mmu04610:Complement and coagulation cascades. For f GO:0005764~lysosome. p-values for pathway analysis and source data for relevant panels are provided in the Source Data file.
Fig. 5
Fig. 5. Loss of Rab30 does not influence hepatic triglyceride content.
a Wet liver weights (large left lobe) normalized to body weight of fasted male and female mice. Data are represented as average ±SEM. Asterisks denote significance between knockouts and their littermate controls (Control, Rab30 ff, Cpt2 ff, and ff;ff for Rab30KO, Rab30L−/−, Cpt2L−/−, and DKO, respectively) by two-tailed t-test: *p < 0.05; **p < 0.01; ***p < 0.001, ****p < 0.0001. b 24 h fasted livers of control, Rab30L−/−, Cpt2L−/−, and Rab30;Cpt2 DKO female mice. c 24 h fasted histology of H&E and BODIPY 493/503 stained livers from control, Rab30KO, Cpt2L−/−, and Rab30;Cpt2 DKO male mice. Scale bar represents 50 µm. Blue in the BODIPY 493/503 images is Hoechst 33342 nuclear stain. Both experiments were performed in 2 mice per genotype. d Hepatic triglyceride levels in 24 h fasted male mice livers. Controls are Ctrl (n = 8) for Rab30KO (n = 8), ff (n = 8) for Rab30L−/− (n = 9), and ff;ff (n = 9) for Cpt2L−/− (n = 9) and DKO (n = 8) controls. Data are represented at average ± SEM. Significance was determined by two-tailed unpaired t-test for Ctrl vs Rab30KO (p = 0.32) and ff vs Rab30L−/− (p = 0.42). Significant differences between ff;ff, Cpt2L−/−, and DKO were determined by one-way ANOVA; letters indicate significance groups after Tukey’s multiple comparisons test. e BODIPY 493/503 stained 24 h fasted livers from Rab30;Cpt2 floxed (ff;ff) and DKO females expressing mScarletI-Rab30 in hepatocytes by adenoassociated virus. Blue in merge is Hoechst 33342 nuclear stain. Scale bar represents 10 µm. Experiments were performed in 2 mice per genotype. f Comparison of mScarletI-Rab30 localization in 24 h fasted AtglL−/− and DKO female livers stained with BODIPY 493/503. Experiment was performed in 1 AtglL−/− female and 2 DKO females. If not reported in the legend, all n, p-values, ANOVA tables, and source data for relevant panels are provided in the Source Data file.
Fig. 6
Fig. 6. Loss of Rab30 influences fasting circulating triglyceride and cholesterol and suppresses dyslipidemia in fatty acid oxidation deficiency.
a Fed and fasting triglyceride (TG), nonesterified fatty acid (NEFA), cholesterol, and β-hydroxybutyrate (βHB) levels in the serum of male Rab30KO and littermate control (Ctrl) mice. Fed, n = 8/genotype. Fast, n = 7/genotype, except n = 6 Rab30KO for cholesterol. b Fasting TG, NEFA, cholesterol, and βHB levels in the serum of male Rab30L−/− and control (ff) mice. n = 8/genotype, except n = 7 Rab30L−/− for cholesterol. c Fed and fasting TG, NEFA, cholesterol, and βHB levels in the serum of male Cpt2L−/−, DKO, and control (ff;ff) mice. n = 8 for all genotypes across both states, except n = 7 DKO for cholesterol. In all panels, data are represented as average ±SEM. Significant differences (p-value < 0.05) were determined by two-tailed unpaired t-test in a and b and by Tukey’s multiple comparison’s test following one-way ANOVA in c. *p < 0.05; shared letters indicate same significance level. p-values, ANOVA tables, and source data for relevant panels are provided in the Source Data file.
Fig. 7
Fig. 7. Loss of Rab30 impacts circulating ApoA4 abundance.
a Coomassie stained gel for total protein in the serum (0.5 μl/lane) of fasted male mice. n = 4 mice for ff;ff, Cpt2L−/−, and DKO, while n = 3 mice for Rab30L−/−. Bands A and B were excised for mass spectrometry analysis. b Representative ApoA4 immunoblot in the serum (1 μl/lane) of 24 h fasted ff;ff, Rab30L−/−, Cpt2L−/−, and DKO males and females. c Left, quantification of ApoA4 band intensity in serum of 24 h fasted males (n = 12 males/genotype); Right, quantification of ApoA4 band intensity in serum of 24 h fasted females (n = 12 females for ff;ff and Rab30L−/−, and n = 11 females for Cpt2L−/− and DKO). See Supplementary Fig. 6a–d for associated western blot for the quantitation. d Left, qRT-PCR of ApoA4 mRNA in 24 h fasted livers of males (n = 7 for ff;ff and Rab30L−/−, 5 for Cpt2L−/−, and 8 for DKO); Right, qRT-PCR of ApoA4 mRNA in 24 h fasted livers of females (n = 7 for ff;ff and DKO and 8 for Rab30L−/− and Cpt2L−/−). Letters indicate significance groups by Tukey’s multiple comparisons test following one-way ANOVA. ANOVA tables and source data for relevant panels are provided as a Source Data file.

Similar articles

Cited by

References

    1. Schulze RJ, Schott MB, Casey CA, Tuma PL, McNiven MA. The cell biology of the hepatocyte: A membrane trafficking machine. J. Cell Biol. 2019;218:2096–2112. doi: 10.1083/jcb.201903090. - DOI - PMC - PubMed
    1. Fougerat A, et al. ATGL-dependent white adipose tissue lipolysis controls hepatocyte PPARα activity. Cell Rep. 2022;39:110910. doi: 10.1016/j.celrep.2022.110910. - DOI - PubMed
    1. Preidis GA, Kim KH, Moore DD. Nutrient-sensing nuclear receptors PPARα and FXR control liver energy balance. J. Clin. Investig. 2017;127:1193–1201. doi: 10.1172/JCI88893. - DOI - PMC - PubMed
    1. Lee JM, et al. Nutrient-sensing nuclear receptors coordinate autophagy. Nature. 2014;516:112–115. doi: 10.1038/nature13961. - DOI - PMC - PubMed
    1. Kim KH, Moore DD. Regulation of Liver Energy Balance by the Nuclear Receptors Farnesoid X Receptor and Peroxisome Proliferator Activated Receptor α. Digestive Dis. 2017;35:203–209. doi: 10.1159/000450912. - DOI - PubMed