Phenotypes for general behavior, activity, and body temperature in 3q29 deletion model mice
- PMID: 38453903
- PMCID: PMC10920862
- DOI: 10.1038/s41398-023-02679-w
Phenotypes for general behavior, activity, and body temperature in 3q29 deletion model mice
Abstract
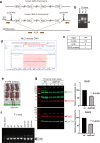
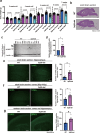
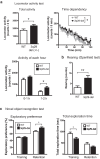
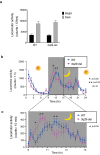
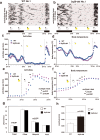
Whole genome analysis has identified rare copy number variations (CNV) that are strongly involved in the pathogenesis of psychiatric disorders, and 3q29 deletion has been found to have the largest effect size. The 3q29 deletion mice model (3q29-del mice) has been established as a good pathological model for schizophrenia based on phenotypic analysis; however, circadian rhythm and sleep, which are also closely related to neuropsychiatric disorders, have not been investigated. In this study, our aims were to reevaluate the pathogenesis of 3q29-del by recreating model mice and analyzing their behavior and to identify novel new insights into the temporal activity and temperature fluctuations of the mouse model using a recently developed small implantable accelerometer chip, Nano-tag. We generated 3q29-del mice using genome editing technology and reevaluated common behavioral phenotypes. We next implanted Nano-tag in the abdominal cavity of mice for continuous measurements of long-time activity and body temperature. Our model mice exhibited weight loss similar to that of other mice reported previously. A general behavioral battery test in the model mice revealed phenotypes similar to those observed in mouse models of schizophrenia, including increased rearing frequency. Intraperitoneal implantation of Nano-tag, a miniature acceleration sensor, resulted in hypersensitive and rapid increases in the activity and body temperature of 3q29-del mice upon switching to lights-off condition. Similar to the 3q29-del mice reported previously, these mice are a promising model animals for schizophrenia. Successive quantitative analysis may provide results that could help in treating sleep disorders closely associated with neuropsychiatric disorders.
© 2024. The Author(s).
Conflict of interest statement
The authors declare no competing interests.
Figures

Similar articles
-
Psychiatric-disorder-related behavioral phenotypes and cortical hyperactivity in a mouse model of 3q29 deletion syndrome.Neuropsychopharmacology. 2019 Nov;44(12):2125-2135. doi: 10.1038/s41386-019-0441-5. Epub 2019 Jun 19. Neuropsychopharmacology. 2019. PMID: 31216562 Free PMC article.
-
Behavioral changes and growth deficits in a CRISPR engineered mouse model of the schizophrenia-associated 3q29 deletion.Mol Psychiatry. 2021 Mar;26(3):772-783. doi: 10.1038/s41380-019-0413-5. Epub 2019 Apr 11. Mol Psychiatry. 2021. PMID: 30976085 Free PMC article.
-
Metabolic effects of the schizophrenia-associated 3q29 deletion.Transl Psychiatry. 2022 Feb 17;12(1):66. doi: 10.1038/s41398-022-01824-1. Transl Psychiatry. 2022. PMID: 35177588 Free PMC article.
-
Unraveling the genetic architecture of copy number variants associated with schizophrenia and other neuropsychiatric disorders.J Neurosci Res. 2017 May;95(5):1144-1160. doi: 10.1002/jnr.23970. Epub 2016 Nov 8. J Neurosci Res. 2017. PMID: 27859486 Free PMC article. Review.
-
Autistic and psychiatric findings associated with the 3q29 microdeletion syndrome: case report and review.Am J Med Genet A. 2010 Oct;152A(10):2459-67. doi: 10.1002/ajmg.a.33573. Am J Med Genet A. 2010. PMID: 20830797 Review.
Cited by
-
Mice with deficiency in Pcdh15, a gene associated with bipolar disorders, exhibit significantly elevated diurnal amplitudes of locomotion and body temperature.Transl Psychiatry. 2024 May 28;14(1):216. doi: 10.1038/s41398-024-02952-6. Transl Psychiatry. 2024. PMID: 38806495 Free PMC article.
References
MeSH terms
Grants and funding
- 22K07369/MEXT | Japan Society for the Promotion of Science (JSPS)
- 19K07384/MEXT | Japan Society for the Promotion of Science (JSPS)
- 20K20602/MEXT | Japan Society for the Promotion of Science (JSPS)
- 21H04815/MEXT | Japan Society for the Promotion of Science (JSPS)
- JP22tm0424222/Japan Agency for Medical Research and Development (AMED)
- JP21wm0425007/Japan Agency for Medical Research and Development (AMED)
- JP19dm0207075/Japan Agency for Medical Research and Development (AMED)
- JP21dk0307103/Japan Agency for Medical Research and Development (AMED)
- P20dk0307099/Japan Agency for Medical Research and Development (AMED)
- JP20ek0109488/Japan Agency for Medical Research and Development (AMED)
- JP22tm0424222/Japan Agency for Medical Research and Development (AMED)
- JP19ak0101113/Japan Agency for Medical Research and Development (AMED)
- JP19dm0207069/Japan Agency for Medical Research and Development (AMED)
- JP22gm1410011/Japan Agency for Medical Research and Development (AMED)
- JP19ak0101126/Japan Agency for Medical Research and Development (AMED)
- JP23gm1910005/Japan Agency for Medical Research and Development (AMED)
- JP23ek0109678/Japan Agency for Medical Research and Development (AMED)
- JP23ak0101215/Japan Agency for Medical Research and Development (AMED)
LinkOut - more resources
Full Text Sources
Medical

