. 2023 Dec 8;14(1):8134.
doi: 10.1038/s41467-023-43299-8.

Quantitative proteomics defines mechanisms of antiviral defence and cell death during modified vaccinia Ankara infection

Affiliations

Quantitative proteomics defines mechanisms of antiviral defence and cell death during modified vaccinia Ankara infection

Jonas D Albarnaz et al. Nat Commun. .

Abstract

Modified vaccinia Ankara (MVA) virus does not replicate in human cells and is the vaccine deployed to curb the current outbreak of mpox. Here, we conduct a multiplexed proteomic analysis to quantify >9000 cellular and ~80% of viral proteins throughout MVA infection of human fibroblasts and macrophages. >690 human proteins are down-regulated >2-fold by MVA, revealing a substantial remodelling of the host proteome. >25% of these MVA targets are not shared with replication-competent vaccinia. Viral intermediate/late gene expression is necessary for MVA antagonism of innate immunity, and suppression of interferon effectors such as ISG20 potentiates virus gene expression. Proteomic changes specific to infection of macrophages indicate modulation of the inflammatory response, including inflammasome activation. Our approach thus provides a global view of the impact of MVA on the human proteome and identifies mechanisms that may underpin its abortive infection. These discoveries will prove vital to design future generations of vaccines.


Conflict of interest statement

The authors declare no competing interests.

Figures
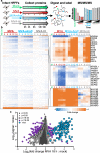
Fig. 1
Fig. 1. Quantitative temporal proteomic analysis of MVA infection.
a Schematic indicating the experimental workflow. b Hierarchical clustering of all proteins quantified in the two biological repeats. An enlargement is shown indicating groups of proteins that were significantly down- or upregulated during the course of the experiment. c Scatterplot of all proteins quantified at 18 h of infection, showing average fold change. P-values were estimated using Significance B values, and corrected for multiple hypothesis testing using the Benjamini–Hochberg method. Significance A and B tests are two-sided tests that allow for non-equal left and right-sided standard deviations, . Dark grey: p > 0.05, Light grey: p < 0.05, Light grey with border: p < 1E−04, Purple: p < 1E−09, Blue: viral. Source data are provided as a Source Data file.
Fig. 2
Fig. 2. MVA regulates multiple mediators of intrinsic, innate and adaptive immunity.
a Functional enrichment analysis of proteins downregulated >2-fold at ≥1 time point during MVA infection of HFFF-TERT cells. P-values were estimated in DAVID software using Fisher’s Exact tests and were corrected for multiple hypothesis testing using the Benjamini–Hochberg method. b Example components from cell surface-related pathways identified in a. n = 2 biological replicates from independent experiments. Data are presented as mean values ± range. C Functional enrichment analysis of groups of proteins regulated as indicated in the left-hand column, and examples of components of enriched pathways. Full data is shown in Supplementary data 2. 2-fold is used throughout the manuscript as a cutoff for downregulation, with proteins unchanged defined as downregulated <1.25 fold at all time points measured. n = 2 biological replicates from independent experiments. Data are presented as mean values ± range. P-values were estimated in DAVID software using Fisher’s Exact tests and were corrected for multiple hypothesis testing using the Benjamini–Hochberg method. d Plot of interactions among proteins decreased upon infection with MVA but unchanged in MVA+AraC and MVA-HI samples (red text = proteins connected by red edges). For context, an additional 74 neighbouring proteins are shown (grey text and dots). Relative proximity to the proteins that were decreased upon infection with MVA but unchanged in MVA+AraC and MVA-HI samples is indicated by red shading, and was quantified via random walk with restart (Methods). E HFFF-TERT cell lines stably expressing the proteins indicated were infected with MVA-GFP at MOI 5. At the indicated times, GFP expression was measured and compared to infected Luciferase (Luc)-expressing cells. Significance calculated using two-way ANOVA followed by post-hoc Dunnet’s multiple comparisons test. Means ± SEM (n = 8 biological replicates per condition, from 4 independent experiments) and p-values < 0.05 are shown. Source data are provided as a Source Data file.
Fig. 3
Fig. 3. Differential protein changes during infection of human fibroblasts with MVA or VACV-WR, and during MVA infection of HFFFs or THP−1 cells.
a Scatterplot of all proteins quantified at 18 h of infection with both MVA and VACV-WR. P-values were estimated using Significance A values (described in the legend to Fig. 1c), and corrected for multiple hypothesis testing using the Benjamini–Hochberg method, and are indicated on the plot via colouring of the dots as indicated in the legend. Example profiles for NF-κB pathway proteins are shown in the lower panels. n = 2 biological replicates from independent experiments. Data are presented as mean values ± range. Grey: p > 0.0005, Blue: p < 0.0005, Purple: p < 1E−10. b Functional enrichment analysis of proteins (i) downregulated by MVA but not VACV Western Reserve (VACV-WR), (ii) downregulated by VACV-WR but not MVA, or (iii) downregulated by both MVA and VACV-WR. P-values were estimated employing the Fisher’s Exact tests and were corrected using the method of Benjamini–Hochberg. c Example components from pathways identified in b. n = 2 biological replicates from independent experiments. Data are presented as mean values ± range. d Scatterplot of all proteins quantified at 12 h of infection in HFFF-TERTs or THP-1s. P-values were estimated and displayed as in a. For ease of visualisation, fold upregulation was limited to a maximum of 50. Grey: p > 0.0005, Blue: p < 0.0005, Purple: p < 1E−10. e Functional enrichment analysis of proteins regulated as indicated. P-values were estimated as in a. f Example components from pathways identified in e. n = 2 biological replicates from independent experiments. Data are presented as mean values ± range. Source data are provided as a Source Data file.
Fig. 4
Fig. 4. MVA infection induces pyroptosis in THP-1 cells.
a Representative temporal profiles of secreted proteins and proteins involved in the inflammasome pathway during MVA infection. (continued Supplementary Figure. 7b). n = 2 biological replicates from independent experiments. Data are presented as mean values ± range. b Cell death assessed by lactate dehydrogenase release assay. PMA-differentiated THP-1 macrophages were treated with the indicated inhibitors and infected with MVA (MOI = 5) for 8 h. Means ± s.d. (n = 3 independent experiments) are shown. c Immunofluorescence to visualise inflammasome assembly (caspase-1/ASC speck formation). Differentiated THP-1 cells that ectopically express CARD1-GFP (THP-1C1C-GFP) were infected with MVA (MOI = 5) for 8 h in presence of caspase-1 inhibitor VX-765 (4-h infection shown in Supplementary Fig. 8). Representative micrographs show caspase-1 CARD-GFP (green), ASC immunostaining (magenta) and DAPI staining (blue). Scale bar = 100 µm. Arrowheads indicate caspase-1/ASC specks. d Quantification of cells with caspase-1 CARD-GFP specks from c. Means ± s.d. (n = 4 biological replicates from 2 independent experiments) are shown. e Immunoblot showing gasdermin D (GSDMD) cleavage is stimulated during MVA infection. Differentiated THP-1s were treated as indicated and infected with MVA (MOI = 5) for 8 h. f ratio of cleaved N-terminal fragment (arrowhead) over full-length GSDMD (indicated by an asterisk) band intensities from e. The positions of molecular mass markers in kDa are shown on the left of immunoblots. Means (n = 2 independent experiments) are shown. Significance in b and d was calculated using one-way ANOVA followed by post-hoc Dunnett’s multiple comparisons test. Source data is provided as a Source Data file.
Fig. 5
Fig. 5. Temporal classes of MVA protein expression.
a Viral proteins were clustered into 4 classes defined by the k-means method. Proteins were subsequently clustered hierarchically within each class. b Examples of each class. Protein names in brackets indicate orthologous proteins from VACV-WR (Supplemental Data 4). n = 2 biological replicates from independent experiments. Data are presented as mean values ± range. c Comparison of MVA viral protein and VACV transcript classes in HFFF. d Functional classification of MVA viral proteins, based on information from for VACV in HeLa cells. Source data is provided as a Source Data file.

Similar articles

Cited by

References

    1. Yinka-Ogunleye A, et al. Outbreak of human monkeypox in Nigeria in 2017-18: a clinical and epidemiological report. Lancet Infect. Dis. 2019;19:872–879. doi: 10.1016/S1473-3099(19)30294-4. - DOI - PMC - PubMed
    1. Babkin IV, Babkina IN, Tikunova NV. An update of orthopoxvirus molecular evolution. Viruses. 2022;14:388. doi: 10.3390/v14020388. - DOI - PMC - PubMed
    1. WHO. Multi-country outbreak of mpox, External situation report#28 – 19 September 2023 (WHO, 2023).
    1. Isidro J, et al. Phylogenomic characterization and signs of microevolution in the 2022 multi-country outbreak of monkeypox virus. Nat. Med. 2022;28:1569–1572. doi: 10.1038/s41591-022-01907-y. - DOI - PMC - PubMed
    1. Bunge EM, et al. The changing epidemiology of human monkeypox-A potential threat? A systematic review. PLoS Negl. Trop. Dis. 2022;16:e0010141. doi: 10.1371/journal.pntd.0010141. - DOI - PMC - PubMed